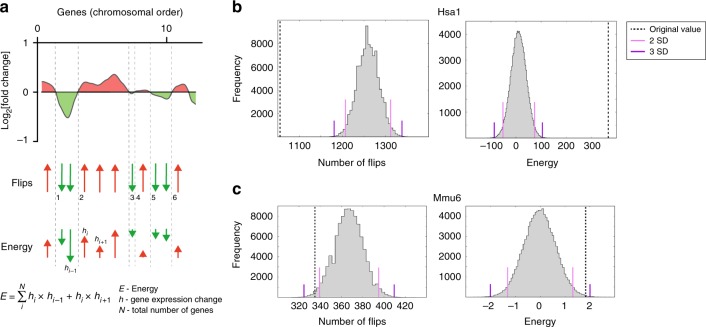
Fig. 3.
Statistical tests for gene expression dysregulation domains. a An example plot of fold change of gene expression against chromosomal position showing regions in which expressed genes are upregulated or downregulated (red and green, respectively). Below this are shown the directions of the fold changes (red and green arrows) with a dashed black line indicating a flip, i.e. a change in direction of the fold change. In the example shown, there are six flips. The energy function (E) is calculated by taking into account both the direction and magnitude of the fold change and is defined as the sum over all genes on the chromosome of the products of the fold change (h) of a given gene (i) with the fold change of the previous gene (i–1) and the same product with the next gene (i+1). b Distribution of flips and energy in 100,000 versions of, for example, Hsa1 each with a different randomised order of genes from the human Down syndrome fibroblast expression data3. Pink and purple lines indicate 2 and 3 standard deviations (SD) away from the mean, respectively; dashed line shows the flips and energy for the actual non-randomised chromosome. c Distribution of flips and energy as described in b, for example chromosome Mmu6 in gene expression data from Dp1Tyb and wild-type mouse embryonic fibroblasts

