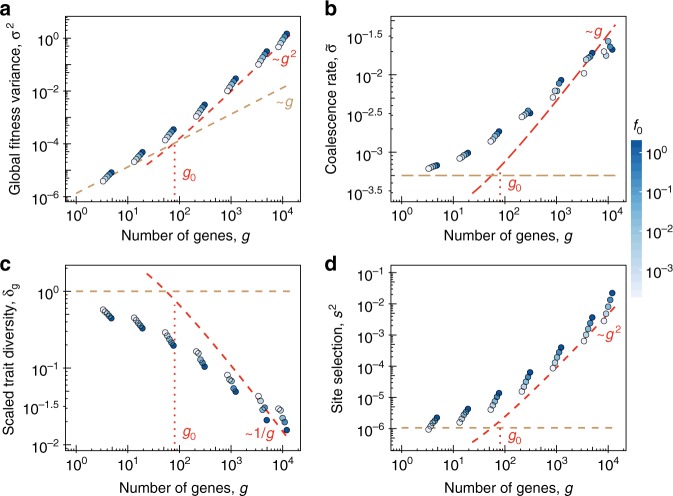
Fig. 2.
Global and local scaling under phenotypic interference. Average population data are plotted against the number of genes, g, for the minimal biophysical model at steady-state asexual evolution. Simulation data (circles) for different average gene selection coefficients f0 (indicated by color) show a crossover from the regime of independently evolving genes (brown dashed lines) to phenotypic interference (red dashed lines). The error bars (SD) are smaller than or equal the diameter of the symbols. The crossover point is marked. a, b Global observables. Average total fitness variance, σ2, and coalescence rate, ; phenotypic interference scaling and (red dashed lines) as given by Eqs. 5, 7 with a fit parameter . c, d Local observables. Average scaled trait diversity and mean square selection coefficient at sequence sites s2; phenotypic interference scaling and (red dashed lines) as given by Eqs. 6, 7. Values indicate that individual proteins are in the low-mutation regime. The scaling is independent of f0, signaling that site selection coefficients emerge from a feedback between global and local selection (see text). Other simulation parameters: , , ; see Methods section for simulation details. Supplementary Fig. 2 shows global and local observables as functions of

