
Fig. 3.
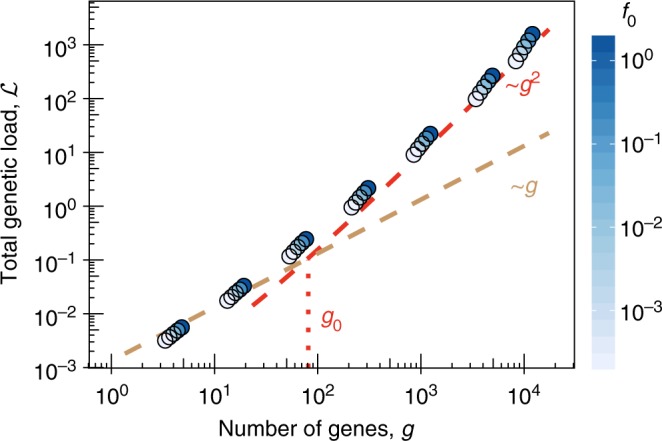
Genetic load. Total genetic load versus the number of genes g for asexual evolution for the minimal biophysical model at steady-state asexual evolution. Simulation results (circles) for different values of f0 (indicated by color, as in Fig. 2); model results for independently evolving genes, (brown dashed line), and phenotypic interference load, (red dashed line); see Eq. 9. The superlinear behavior of for indicates strong selection against genome complexity. Other simulation parameters as in Fig. 2; see Methods section for simulation details