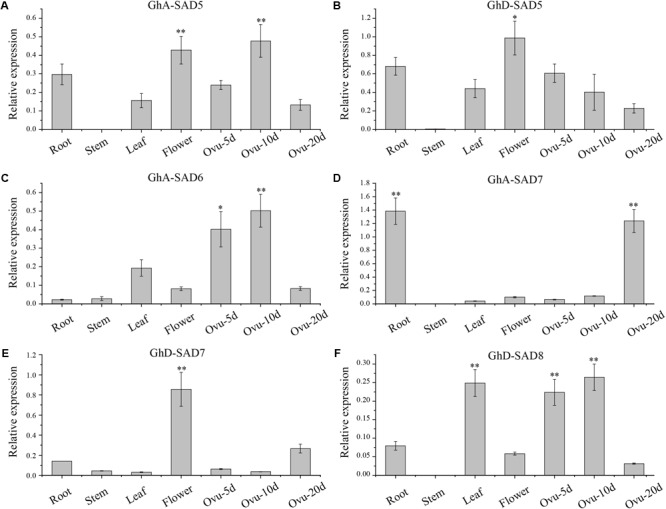
FIGURE 4.

Deduced GhSAD expression patterns of GhA-SAD5 (A), GhD-SAD5 (B), GhA-SAD6 (C), GhA-SAD7 (D), GhD-SAD7 (E), and GhD-SAD8 (F) in various cotton tissues. Bar charts show the relative expression levels of GhSAD genes normalized to that of Histone3 and EF-1α measured by qRT-PCR. The analysis was performed with three biological samples for each tissue. Ovu-5d, 10d and 20d represent 5, 10, and 20 DAF of developing cottonseed ovules. The method of 2-ΔΔcq was used in this analysis. “∗” represents statistically significant difference values of P < 0.05 and “∗∗” for P < 0.01 based on two-tailed Student’s t-tests.
