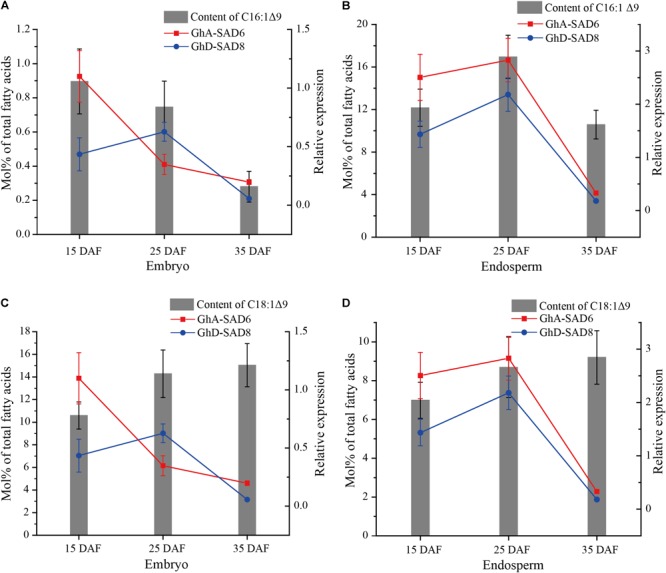
FIGURE 6.

The correlation of the expression of GhA-SAD6 and GhD-SAD8 with molar percentage of C16:1Δ9 or C18:1Δ9 in developing cotton embryos and endosperms. Columns showed fatty acid content (Mol% of total fatty acids) and lines for relative expression (Red for GhA-SAD6, blue for GhD-SAD8). (A,C) represented the correlation between the fatty acid content (C16:1Δ9 or C18:1Δ9) and relative expression levels of GhA-SAD6 or GhD-SAD8 in developing embryos, respectively. (B,D) were the correlation of C16:1Δ9 or C18:1Δ9 content with GhA-SAD6 or GhD-SAD8 in developing endosperms, respectively. Six biological replicates were analyzed in each tissue.
