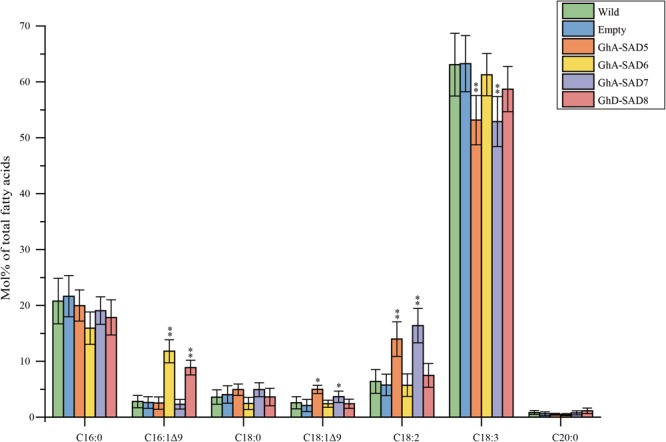
FIGURE 7.

Fatty acid composition in transgenic N. benthamiana leaves of expressing GhA-SAD5, GhA-SAD6, GhA-SAD7, and GhD-SAD8, respectively. Fatty acids were analyzed by GC and the data are means of Mol% ± SE with six biological replicates. “∗” and “∗∗” represent statistically significant difference values from Wt (or empty) of P < 0.05 and P < 0.01 based on two-tailed Student’s t-tests, respectively. Empty vector of pCAMBIA1303 was used as negative control. Data are showed as mean ± SE (n = 6).
