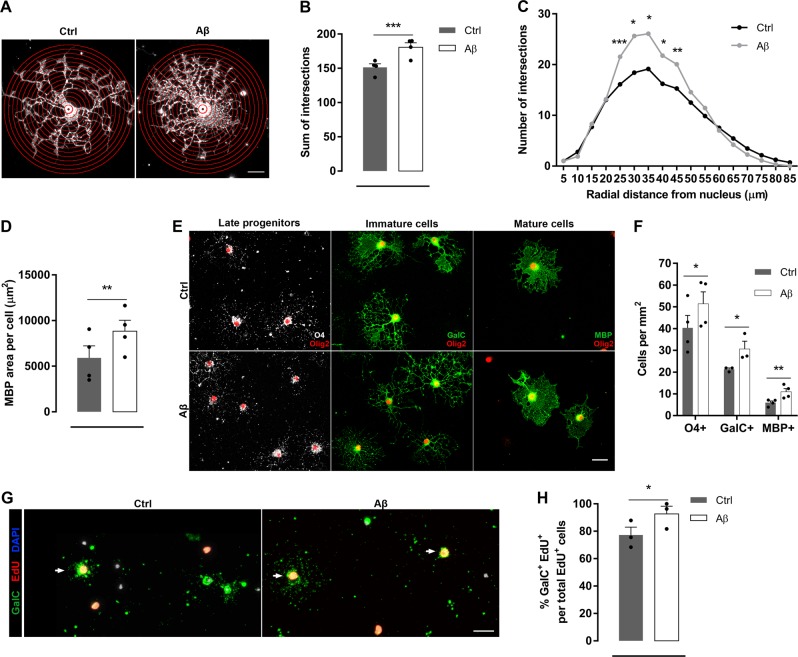
Fig. 2. Aβ oligomers increase morphological differentiation and maturation in oligodendrocytes.
a–f Cells were stimulated in the presence or absence of Aβ 1 µM for 24 h. a MBP-labeled non-treated (Ctrl) and Aβ-treated (Aβ) oligodendrocytes with superimposed concentric circles at 5 µm intervals emerging from nucleus. Scale bar, 10 µm b, c Sholl analysis shows the total number of intersections (b) and grouped by the distance from nucleus (c). d Analysis of the occupied area by the MBP staining per cell (n = 4). e Representative micrographs showing double-immunostaining for oligodendrocyte linage marker Olig2 (red) and O4 (white, late progenitors), GalC (green, immature oligodendrocytes), or MBP (green, mature oligodendrocytes). f The number of specific positive cells was counted after treatment (n = 3–4 cultures). g Double immunolabelling of GalC (green) and EdU (red) in Ctrl and Aβ-treated oligodendrocytes. Arrow indicates new inmature oligodendrocyte (GalC+EdU+). Cell nuclei was visualized by DAPI (blue). h Quantification of the number of newly generated mature oligodendrocytes (GalC+EdU+) (n = 3) (g). Scale bar, 25 µm. Data are represented as means ± S.E.M and were analyzed by paired Student´s t-test. *p < 0.05, **p < 0.01, ***p < 0.001 compared to non-treated cells

