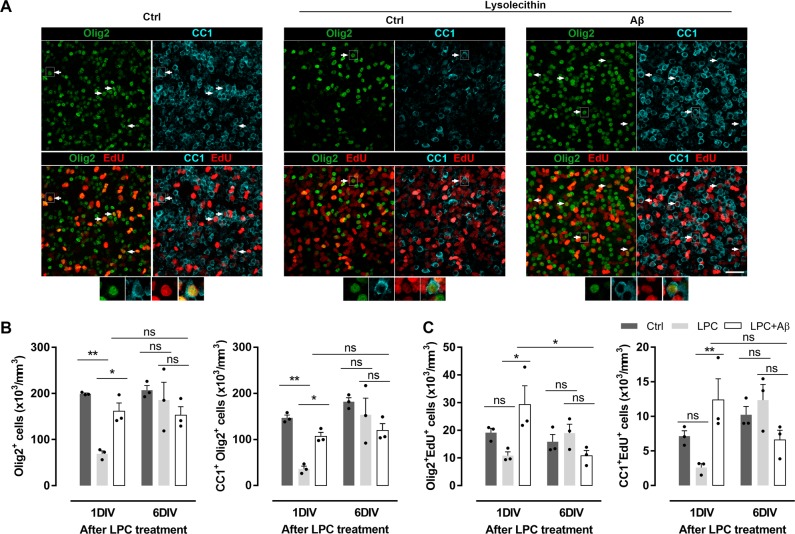
Fig. 8. Aβ oligomers promote oligodendrocyte differentiation after LPC demyelination in cerebellar organotypic slices.
a Staining for Olig2 (green), CC1 (cyan) and EdU (red) in demyelinated cerebellar slices at 1 day post lysolecithin exposure. Scale bar, 50 µm. b Mean number of total oligodendrocytes (Olig2+) and mature oligodendrocytes (CC1 + Olig2 + ) (n = 3). c Quantification of new generated Olig2+ and CC1+ cells after indicated treatments. Arrows indicate new mature oligodendrocytes (CC1+Olig2+EdU+) (n = 3). Higher magnifications of new mature oligodendrocytes delimited by a rectangle in a (botton panel) are shown. Data are represented as means ± S.E.M and were analyzed by one-way ANOVA followed by Holm-Sidak’s multiple comparisons test. *p < 0.05, **p < 0.01, ***p < 0.001 compared to non-treated slices. #p < 0.05 compared to Aβ alone

