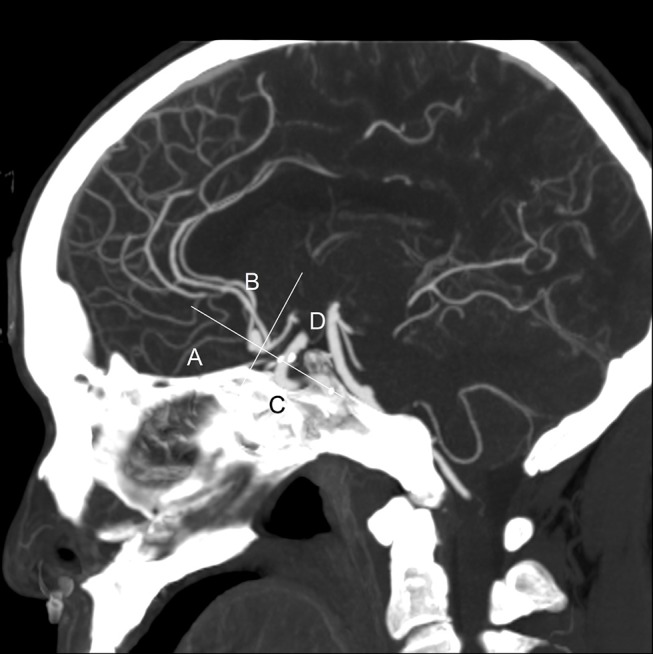
Figure 1.

This is a sagittal maximum intensity projection (MIP) of a computed tomography angiography (CTA) from a typical patient. The directions of aneurysm dome were defined as anterior–inferior (A), anterior–superior (B), posterior–inferior (C), and posterior–superior (D). This picture depicts the direction of the aneurysm dome as B.
