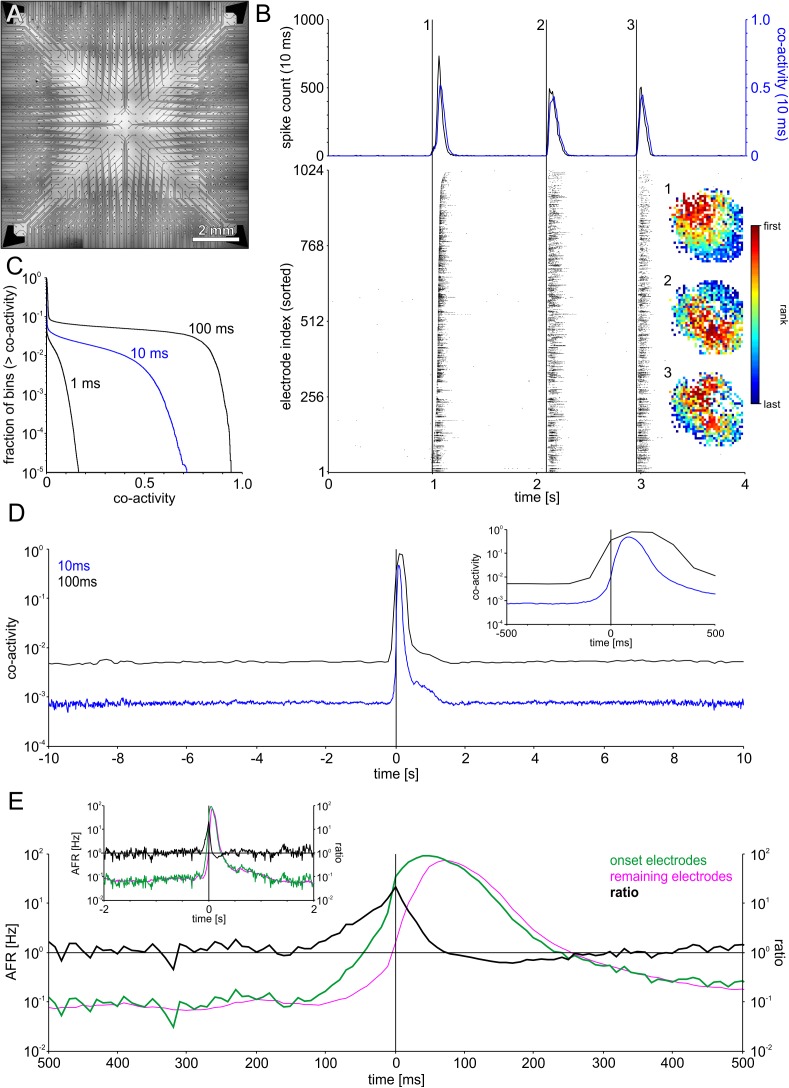
FIGURE 2.
Recording with a large-scale electrode array that spanned the entire network area revealed SBEs starting in different regions (A) Layout of 1k-MEAs (1024 electrodes, 0.3 mm pitch). (B) Successive SBEs initiated at three different sites in an example network followed specific propagation patterns. The subsequent recruitment of the network led to a steep increase and subsequent decline of the global firing rate during SBEs (upper panel). Co-activity captured correlated firing within the network as the fraction of the network active within 10 ms sliding windows. Co-activity dropped to almost zero between peaks, indicating that SBEs are separate events, rather than modulations of sustained network-wide activity. The different propagation patterns are revealed by mapping the rank order of the first spike on each electrode during SBEs. (C) Cumulative frequency distributions indicating the fraction of bins whose co-activity was above a specific level, shown for different bin widths (1, 10, and 100 ms). Even for large bin widths, periods of network wide activity constitute only a small fraction, e.g., for 100 ms bins, co-activity was > 0.5 in ∼5% of the bins. (D) SBE onset-triggered co-activity (window size 10 ms) averaged across all SBEs. In-between SBEs, co-activity was < 0.01 (N = 1887 SBEs). The inset shows a smaller time window surrounding SBE onset. (E) SBE-onset-triggered AFR ratio between the varying set of onset electrodes (first ten electrodes) in SBEs and the respective remainder of the network. AFRs at onset electrodes exceeded the remaining network starting about 150 ms prior to SBE onset time and peaked at SBE onset. The subsequent decrease of AFRs at onset sites below the AFRs in the rest of the networks within a time window of about 200 ms indicates depressed activity in onset areas after SBE initiation. The inset shows a larger time window surrounding SBE onset.

