FIGURE 3.

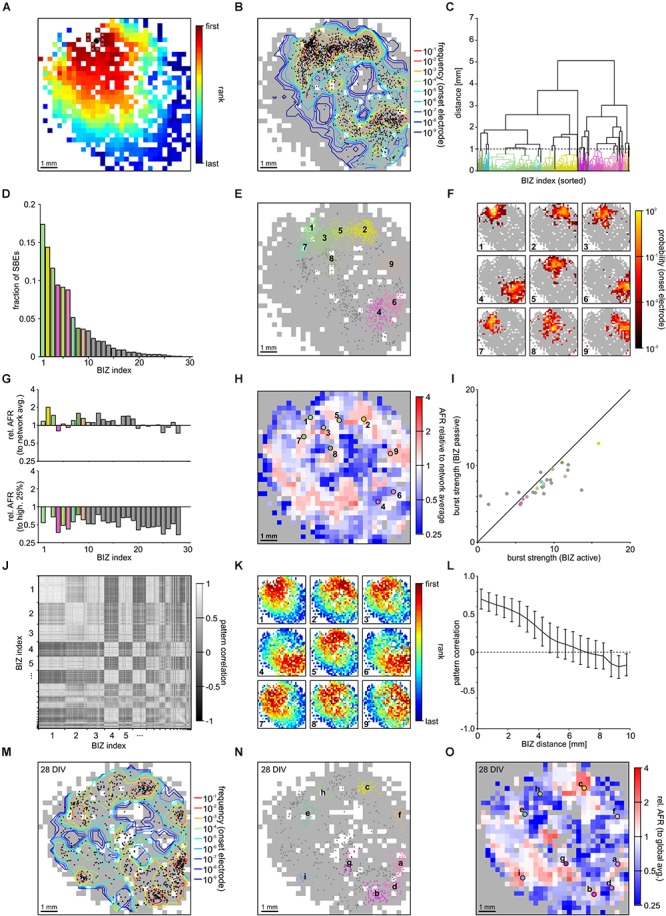
Synchronous bursting events dynamics in a PKCN network at 21 DIV (NW1). (A) SBEs were mostly initiated in compact regions and propagated across the network from there (3 × 3 median filter smoothing). The black spot marks the means of the x and y coordinates of the first ten recruited electrodes that was defined as onset location. (B) Onset locations were distributed across large areas of the network but clustered in certain regions reflecting distinct BIZs (N = 1887 SBEs, t = 165 min; 11.4 SBE/min). Contour lines indicate the frequency with which individual electrodes were among onset electrodes (smoothed by 3 × 3 median filtering). (C) BIZs were identified by spatial centroid clustering of onset locations (cut-off at 1 mm distance between onset locations). (D) Burst initiation was dominated by only few BIZs. For clarity only the nine most frequent BIZ are color coded according to their position. (E) Mapping individual SBE onset locations shown in B to their respective BIZ (color code as in D) indicates that dominating BIZ lay close to but not at the network boundary. (F) BIZs reflected the centers of burst onset regions, which were mostly compact but not confined to extremely localized positions. The maps show the probability by which electrodes were among the first ten onset electrodes of bursts starting within the dominating BIZs. (G) Average relative activity levels at BIZ electrodes (ratio of the mean AFR at BIZ electrodes and of all other electrodes with spike activity). Activity levels were often slightly above network average in BIZs but always lower than the 25% of highest AFRs. (H) Map of relative activity levels (ratio between the AFR at individual electrodes and network AFR during SBEs). BIZs appeared mostly located on transitions between hot and cold spots. (I) Median burst strength at BIZ electrodes when driving SBEs (active) or recruited during SBEs initiated by other BIZs (passive). Activity in the major BIZs was only slightly higher when they initiated SBEs or were passively recruited into the SBE. (J) Similarity between propagation patterns was determined as the correlation of FSRO. Sorting correlation coefficients according to BIZ assignment reveals a high correlation between propagation patterns originating at the same BIZs. (K) Average propagation patterns elicited by the nine most frequent BIZs. (L) The correlation between propagation patterns decreased with increasing distance between BIZs, which yielded slightly anti-correlated patterns for BIZ located at opposite sides of the network. (M) The distribution of SBE onset locations for the same network recorded one week later was highly similar (28 DIV, N = 814 SBE, t = 61 min; 13.3 SBE/min). (N) The overall distribution of BIZs was mostly preserved during development (colors code as in D). Comparing letter sequence (reflecting decreasing frequency) to the numbers in E shows, however, that their influence had changed. (O) Relative activity levels across the MEA displayed comparable patterns at 21 and 28 DIV.
