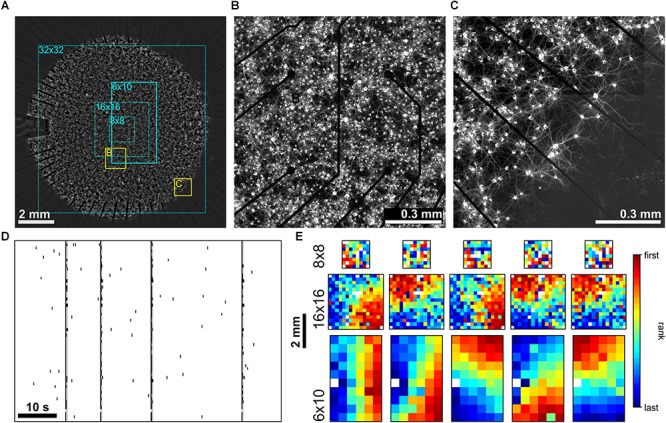
FIGURE 4.

(A) PKC- networks (∼150,000 neurons on ∼100 mm2) displayed a much more homogeneous arrangement of cell bodies and dendrites in central and boundary regions. (B) Zoom into the central region of the network recorded by the MEA (yellow rectangle in A). (C) Homogeneity in the arrangement of cell bodies and neurites extended to the boundary of the network (yellow rectangle in A). Dendrites extended beyond the cell body boundary and did not fasciculate as in PKCN networks. (D) MEA Recordings of SBE activity at 21 DIV (network shown in A). (E) Exemplary SBE propagation patterns assessed by 8 × 8 (top row), 16 × 16 (middle row) and 6 × 10 (bottom row, network in A) MEAs in different PKC- networks at 20–30 DIV. Color codes for the rank order of first spikes on an electrode in the course of SBEs. SBE origins were mostly located outside of the area recorded.
