
Fig. 2.
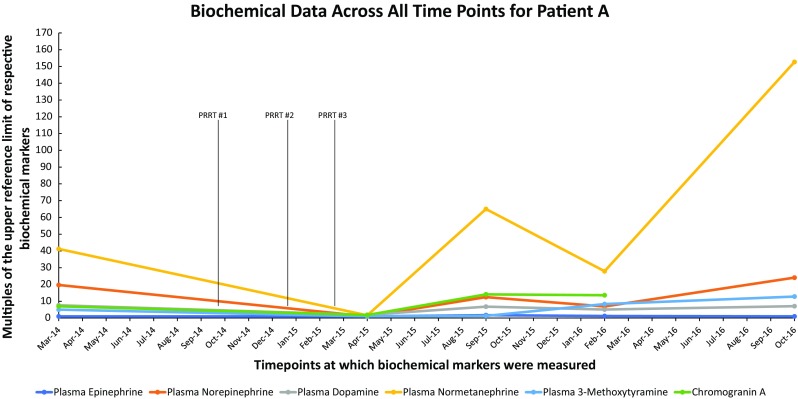
Biochemical data across all time points for Patient A. A graph showing multiples of the upper reference limit of biochemical markers on the Y-axis and various timepoints at which biochemical markers were measured on the X-axis in patient A
Official websites use .gov
A
.gov website belongs to an official
government organization in the United States.
Secure .gov websites use HTTPS
A lock (
) or https:// means you've safely
connected to the .gov website. Share sensitive
information only on official, secure websites.
Biochemical data across all time points for Patient A. A graph showing multiples of the upper reference limit of biochemical markers on the Y-axis and various timepoints at which biochemical markers were measured on the X-axis in patient A