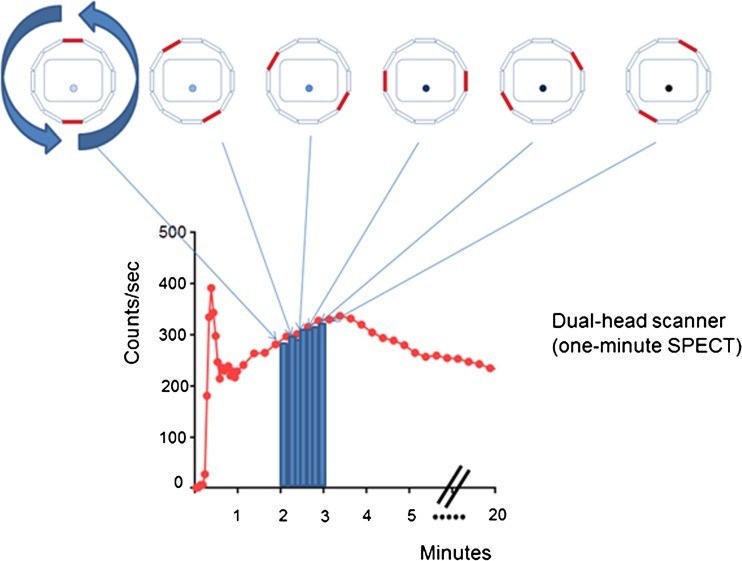
Fig. 4.
Schematic display of 1-min SPECT for measurement of %ID and glomerular filtration rate using dual-head scanner. The time of SPECT acquisition falls upon the upward slope of the renogram of Tc-99m DTPA. Box indicates body contour, and the dot inside simulates a kidney with increasing radioactivity

