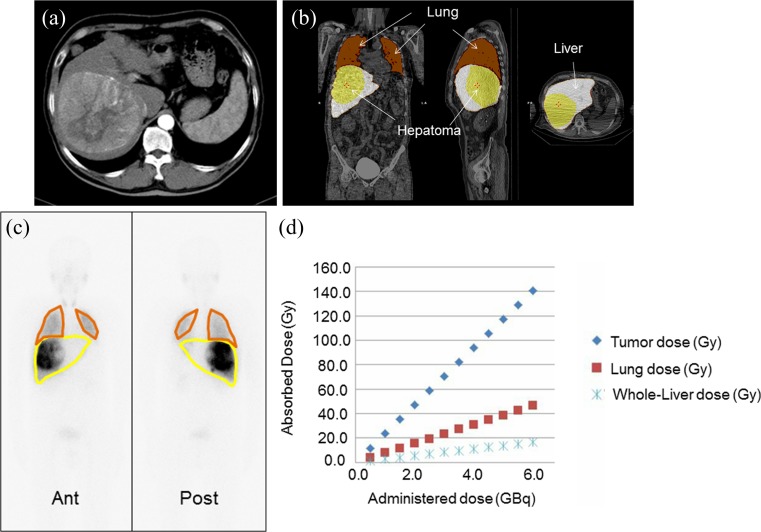
Fig. 7.
Dosimetry of Tc-99m MAA SPECT/CT for Y-90 microsphere TARE. Huge hepatoma is observed in abdominal CT (a). Segmentations of tumor, lung, and non-tumoral liver on CT of SPECT/CT. %injected doses were calculated over the segmented organs (b). Planar scintigraphy showing Tc-99m MAA uptake over the lung, tumor, and liver. The calculated lung-shunt fraction was 26% (c). The dosimetry graph reveals the linear relationship between Y-90 microsphere dose (GBq) and the expected absorbed dose (Gy). If 6.0 GBq is administered, the expected absorbed dose to tumor will be more than 120 Gy, but the expected lung dose will be over 40 Gy, which is unacceptable. If 2.0 GBq is delivered to the patient, the expected lung absorbed dose will be within the acceptable range of less than 20 Gy, but the expected tumor dose is merely 40 Gy, thus a therapeutic effect is not expected

