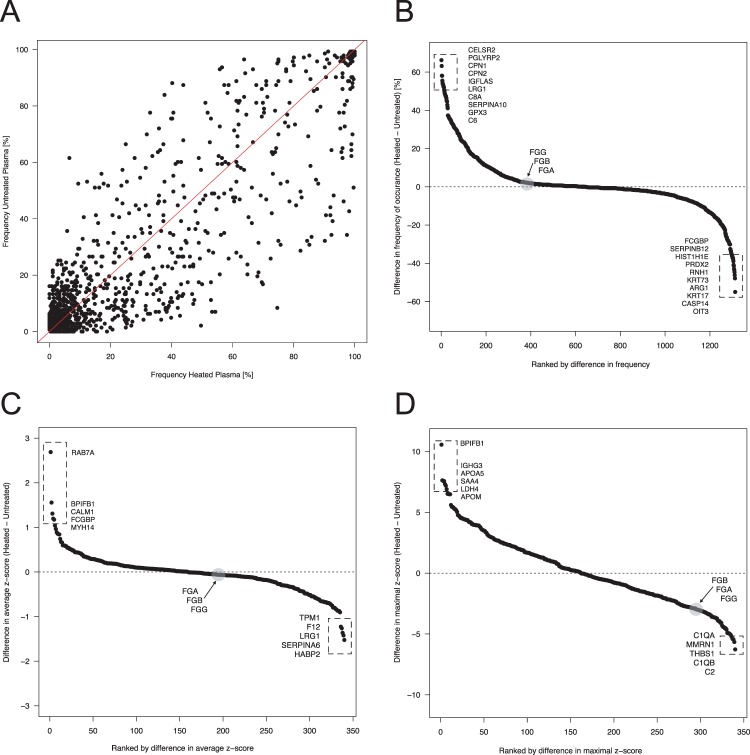
Figure 2.
Comparison of heat-treated and untreated plasma. (A) The relation between the frequencies of all identified proteins in heat-treated and untreated plasma is shown. The red line represents the line of identity. The Spearman correlation was rho = 0.83 (p < 2 × 10⁻¹⁶). (B) Using the differences between frequencies in heat-treated and untreated samples highlights the proteins prone to be more commonly detected in either preparation. This is related to the fibrinogens (FGA, FGB, FGG), which were the proteins found to be most different when using LFQ intensity as a measure of abundance (S-Fig. 5A–C). In (C) is the comparison of the enrichment using the difference in average z-scores between the 340 proteins noted as common contaminants in both heat-treated and untreated plasma. (D) Comparison of enrichment scores of using the difference in maximal z-scores between the 340 proteins.

