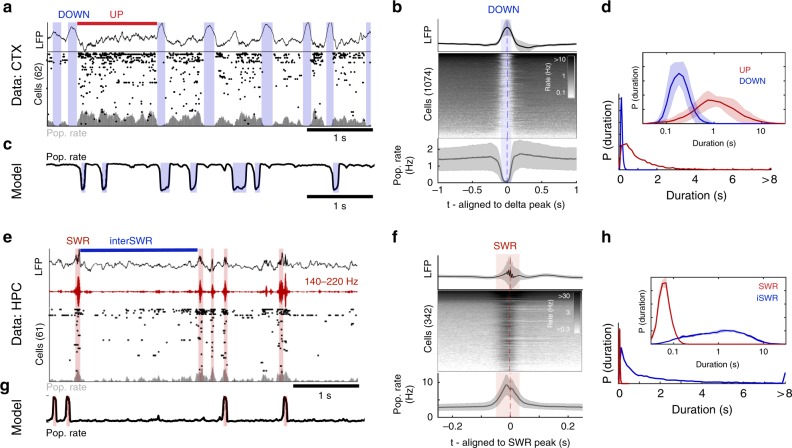
Fig. 1.
Neocortical UP/DOWN and hippocampal SWR dynamics during NREM sleep. a A sample of data from rat mPFC during NREM sleep. Data were collected using high-density silicon probes19. LFP and spike times from cortical neurons were extracted as reported previously (see Methods). Neocortical slow waves are coincident with population-wide non-spiking DOWN states, which alternate with UP states of longer duration. b Peri-event time histogram aligned to delta peaks for the LFP (top), all recorded cells (middle), and population rate (bottom). c Simulation of the model (Eqns 1–2). Parameters determined by matching in vivo and simulated UP/DOWN state dwell times, as described in section: ‘Neocortex is in an ExcitableUP regime during NREM sleep’. d UP/DOWN state dwell time distribution (bottom) in linear (example recording) and logarithmic scale. e A sample of data from rat CA1 (HPC) during NREM sleep65. Detected sharp wave-ripples (SWR) indicated with red. f Peri-event time histogram aligned to SWR peaks for the LFP (top), all recorded cells (middle), and population rate (bottom). g Simulated r-a model with the best-matching parameters, as described in section: ‘Hippocampus is in an ExcitableDOWN regime during NREM sleep’. h SWR and inter-SWR duration distributions in linear (example recording) and logarithmic scale. All shaded lines reflect mean ± standard deviation over recordings

