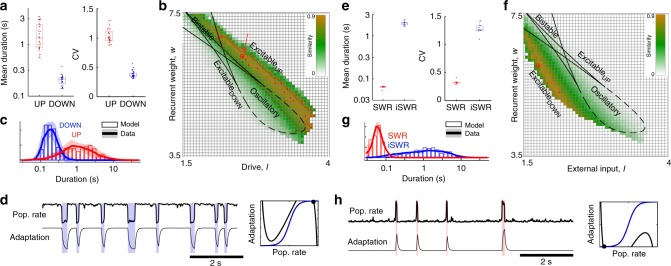
Fig. 4.
Neocortex and hippocampus are in excitable regimes during NREM sleep. a Mean and CV of UP/DOWN state durations, each point is a single recording session. b Similarity between simulated and experimental duration distributions (see Supplementary Fig. 6, Methods for similarity calculation). Color indicates mean similarity over all recordings, red line outlines region for which model simulations fall within mean ± 2STD of experimentally observed CVUP, CVDOWN and meanUP/meanDOWN ratio. 25 red dots indicate the most similar parameters for each of the 25 recordings, and large circle (arrow) is best mean similarity. c Neocortical duration distributions for data and model simulation in the best mean similarity parameters indicated in b. (I = 2.64, W = 6.28, b = 1). d Simulated r-a model with the best-matching parameters. (Right) Phase plane diagram for model with best-fit parameters, in the ExcitableUP regime. e Mean and CV of SWR/interSWR state durations, each point is a single recording session (n = 7 hippocampal sessions). f Similarity between simulated and experimental duration distributions as in b. g Hippocampal duration distributions for data and model simulation in the best mean similarity parameters. h Simulated r–a model with the best-matching parameters indicated in f. (I = 1.9, W = 6, b = 1). (Right) Phase plane diagram for model with best-fit parameters, in the ExcitableDOWN regime. Box plots center line: median, box limits: upper/lower quartiles, whiskers: data range (excluding outliers). Shaded lines reflect mean ± standard deviation over recordings

