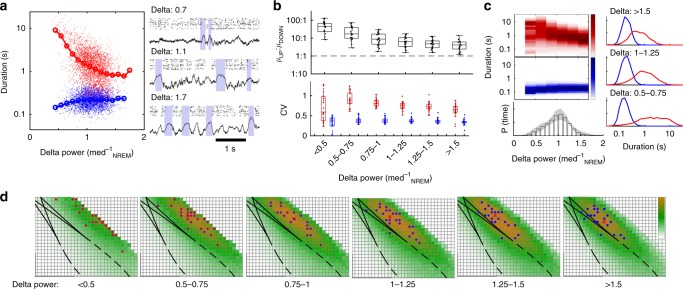
Fig. 5.
State-dependent variation in alternation dynamics during NREM sleep. a UP/DOWN state durations as a function of delta (1–4 Hz) power in a representative recording (delta power normalized to median power during NREM sleep). b (Top)Ratio of mean UP/DOWN durations in each neocortical recording as a function of delta power. (Bottom) CV of UP/DOWN durations in each neocortical recording as a function of delta power. Center line: media, box limits: upper/lower quartiles, whiskers: data range (excluding outliers). c (Top) Mean distribution of UP and DOWN state durations as a function of delta power in the surrounding 8 s window. Color indicates the observed proportion of UP/DOWN states with a given duration. (Bottom) Mean delta power distribution over all recordings, (error shade: standard deviation). (Right) Mean UP/DOWN state duration distributions for high, medium, and low delta power. d Map of in vivo-model similarity (as in Fig. 4b, with τr fixed at τr = 5 ms), for the delta-power groups as in c

