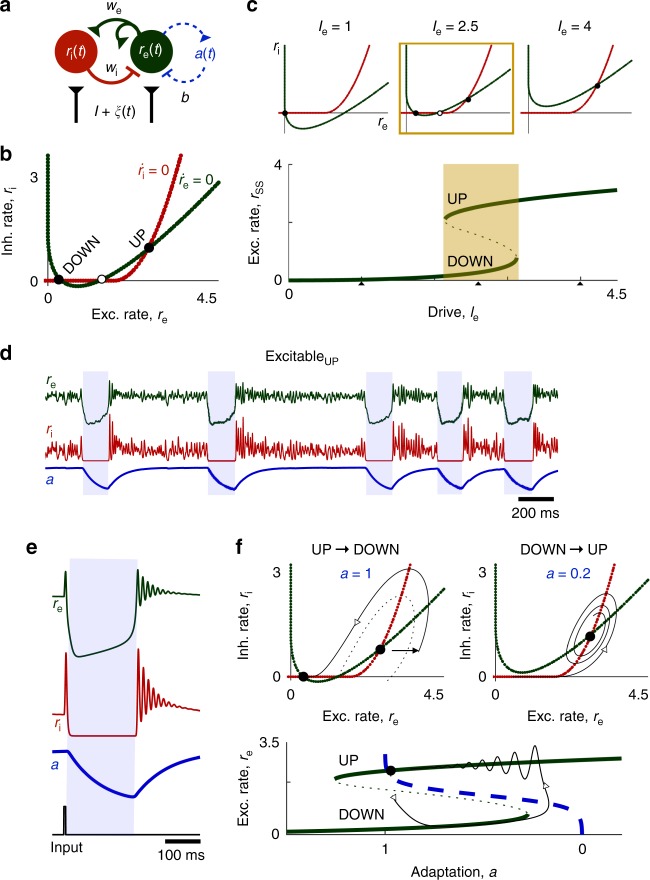
Fig. 6.
UP/DOWN dynamics in an Adapting Inhibition-Stabilized Network (aISN). a Model schematic. b re–ri phase plane with a frozen. c Bistability in the aISN with a frozen. Effective I/O curve of the excitatory population rate, rss, with re–ri phase planes at low, intermediate, and high levels of drive to the E population (Top). Parameters: we = 4, wi = 3. d ExcitableUP dynamics in the aISN. Parameters: τe = τi = 5 ms, τa = 200 ms. e UP/DOWN transitions in the ExcitableUP aISN. (Left) Time course of the model in response to brief excitatory input to the excitatory population. f (Bottom) Trajectory of the time course in the re–a phase plane after stimulus-induced transition. The effective I/O curve, rss, and the steady state adaptation curve, A∞(r), act like the r and a nullclines in the excitation only model. (Top) Trajectories of the stimulus-induced UP→DOWN and subsequent DOWN→UP transition in the re-ri phase plane. The dotted line separates the basin of attraction for the DOWN and UP state fixed points

