Fig. 7.
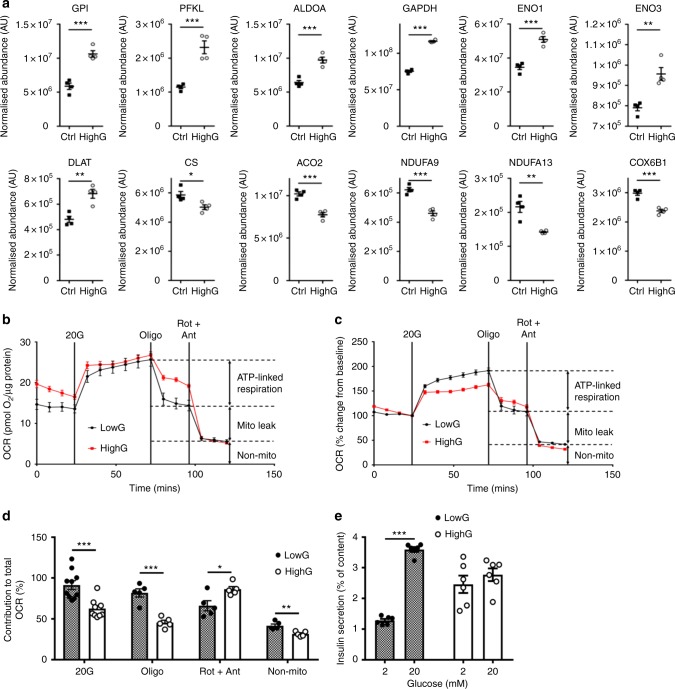
Hyperglycaemia alters oxidative metabolism in INS-1 832/13 cells. a Abundance of the indicated proteins, quantified by mass spectrometry, in INS-1 cells cultured at 5 mM (black, Ctrl) or 25 mM (white, highG) glucose. Mean ± s.e.m. (n = 4 replicates) and individual data points are indicated. *p < 0.05, **p < 0.01, ***p < 0.001. Student’s t test (unpaired, two-sided). Above, enzymes involved in glycolysis. GPI, glucose 6-phosphate isomerase. PFKL, 6-phosphofructokinase, liver type. ALDOA, aldolase A. GAPDH, Glyceraldehyde 3-phosphate dehydrogenase. ENO1, enolase 1. ENO3, enolase 3. Below, mitochondrial enzymes. DLAT, dihydrolipoyllysine-residue acetyltransferase (a component of the pyruvate dehydrogenase complex). CS, citrate synthase. ACO2, aconitase 2. NDUFA9 and NDUF13, subunits 9 and 13 of NADH dehydrogenase:ubiquinone oxidoreductase (Complex 1). COX6B1, Cytochrome c oxidase subunit 6B1. b, c Oxygen consumption rate (OCR) in INS-1 cells cultured for 48 h at 5 mM (black) or 25 mM (red) glucose, expressed as absolute values (b) and as the percentage of change from the OCR baseline in 2 mM glucose (c). Data are mean ± s.e.m., n = 10 replicates/group (2 and 20 mM Glucose); n = 5, other compounds. d Percentage of change in OCR when glucose was raised from 2 to 20 mM (20G, n = 10 replicates/group), ATP-linked OCR (oligo, n = 5 replicates/group), OCR required to maintain the mitochondrial leak (rot + ant, n = 5 replicates/group) and non-mitochondrial OCR (non-mito, n = 5 replicates/group) in INS-1 832/13 cells cultured for 48 h at 5 mM glucose (hatched, lowG) or 25 mM glucose (white, highG). 20 G, 20 mM glucose. Oligo, 5 µM oligomycine. Rot + Ant, 50 µM rotenone + 5 µM antimycin A. Mean ± s.e.m. Student’s t test (unpaired, two-sided). *p < 0.05; **p < 0.01; ***p < 0.001. e Insulin secretion, expressed as a percentage of insulin content, for INS-1 cells cultured for 48 h at 5 mM (lowG, hatched) or 25 mM (highG, white) glucose and then exposed to 2 or 20 mM glucose. Mean ± s.e.m. (n = 6 experiments). Two-way analysis of variance **p < 0.01

