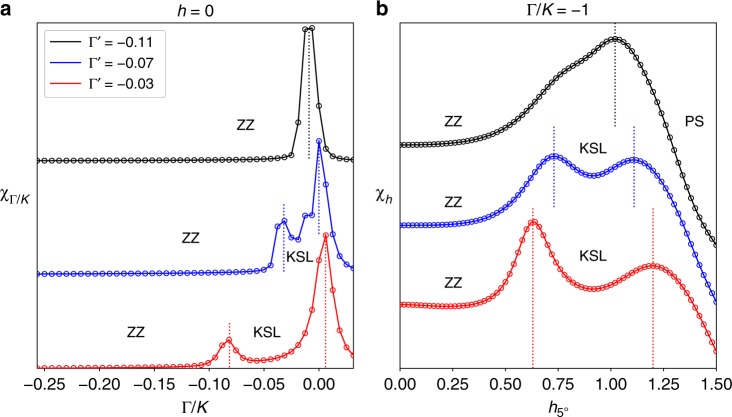
Fig. 3.
Effect of Γ′ on the intermediate phase. The role of Γ′ is illustrated through cuts of the susceptibilities for increasing values of |Γ′| as calculated with ED on a 24-site honeycomb cluster. a The susceptibility χΓ/K is shown at h = 0 near the Kitaev limit for Γ′ = −0.03, −0.07, and −0.11. Peak values of χΓ/K are scaled to the same number and are offset for visibility. With increasing |Γ′| the ZZ phase is seen to expand as the KSL shrinks, and the KSL disappears entirely beyond . b The magnetic susceptibility χh is shown for a 5° tilted field at Γ/K = −1 where the intermediate phase is largest for Γ′ = −0.03. Values of χh are not scaled, but simply offset for visibility. A similar trend is found where the size of the intermediate phase shrinks with increasing |Γ′|. The intermediate KSL disappears beyond where the KSL at h = 0 is overtaken by ZZ magnetic order. Vertical dashed lines represent the position of phase transitions

