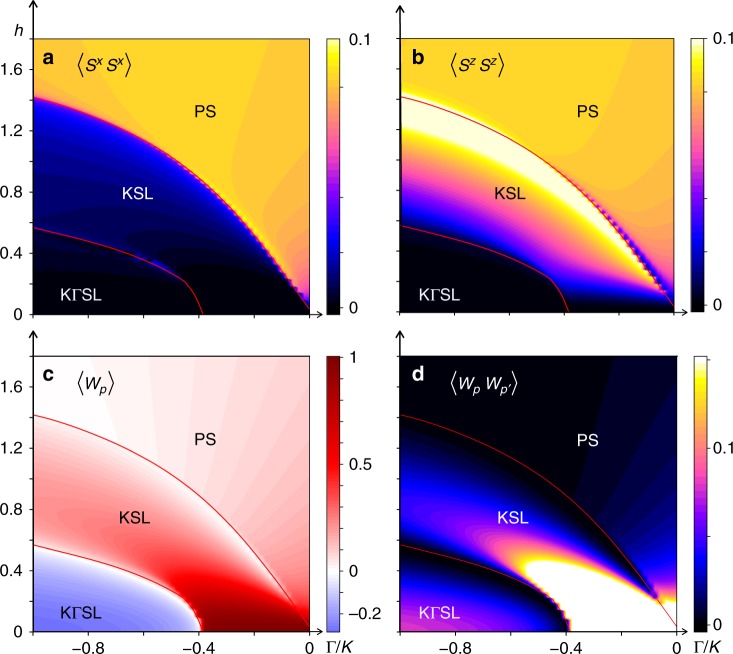
Fig. 6.
Underlying phase diagram. Underlying phase diagram with Γ′ = 0 and θ = 0 in the Γ/K − h plane as calculated with DRMG for N = 200 and OBC. Spin–spin correlations a and b at k − j = 50 are absent within the KΓSL and the KSL phases at h = 0, and develop under the field. Phase boundaries, determined by smoothed fits to the peaks of of χh and χΓ/K, are drawn as red lines, and separate the KΓSL and the PS from the intervening KSL. c Plaquette expectation 〈Wp〉 differentiates the KΓSL and the KSL as it changes sign across the transition. d Plaquette–plaquette correlations at p′ − p = 30 are small in the PS and become appreciable within the KΓSL and KSL, approaching in the limit of large separation

