
Figure 2.
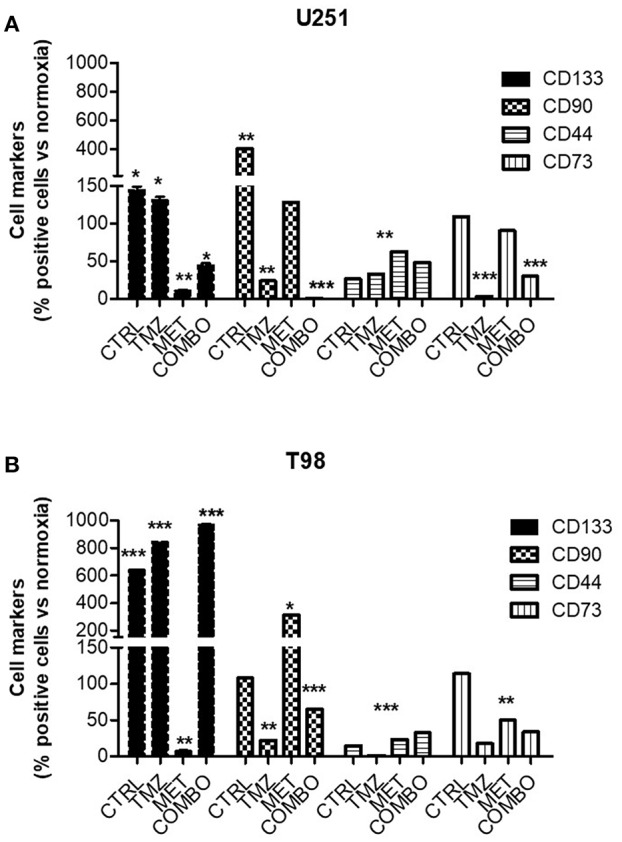
Modulation of key markers of malignancy after treatment. FACS analysis for CD133, CD90, CD44, and CD73 markers in U251 (A) and T98 (B) cells after 48 h of treatment with 25 μM TMZ and/or of 10 mM MET under hypoxia. Data were expressed as the percentage of positive cells on the number of total cells. Data are shown as the mean ± standard deviation. *p < 0.05; **p < 0.01; ***p < 0.001 vs. control sample (in normoxia).