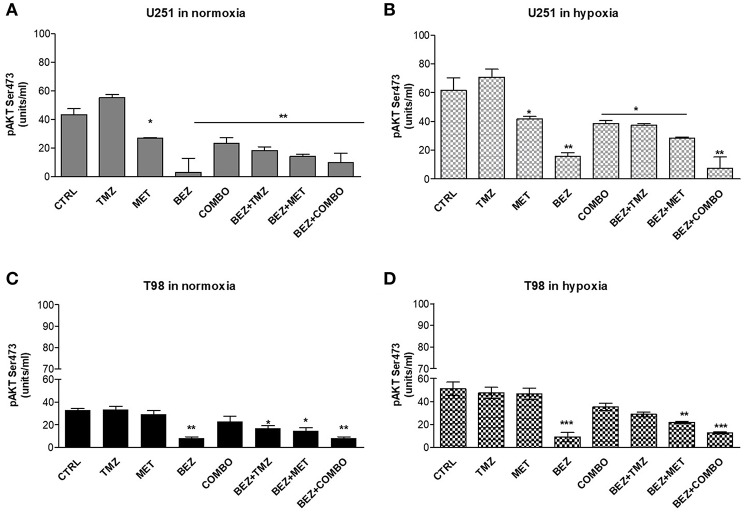
Figure 4.
pAKT modulation by single and combined treatments. pAKT (Ser473) levels were assessed by mean ELISA assay and expressed as units/ml in normoxia (A,C) and hypoxia (B,D) in U251 (A,B) and T98 (C,D) cells after 25 μM TMZ, 10 mM MET, COMBO and/or 1 μM BEZ235 in combination with all the drugs for 48 h. *p < 0.05; **p < 0.01; ***p < 0.001 treated vs. control cells. Mean values ± SD of three independent experiments.

