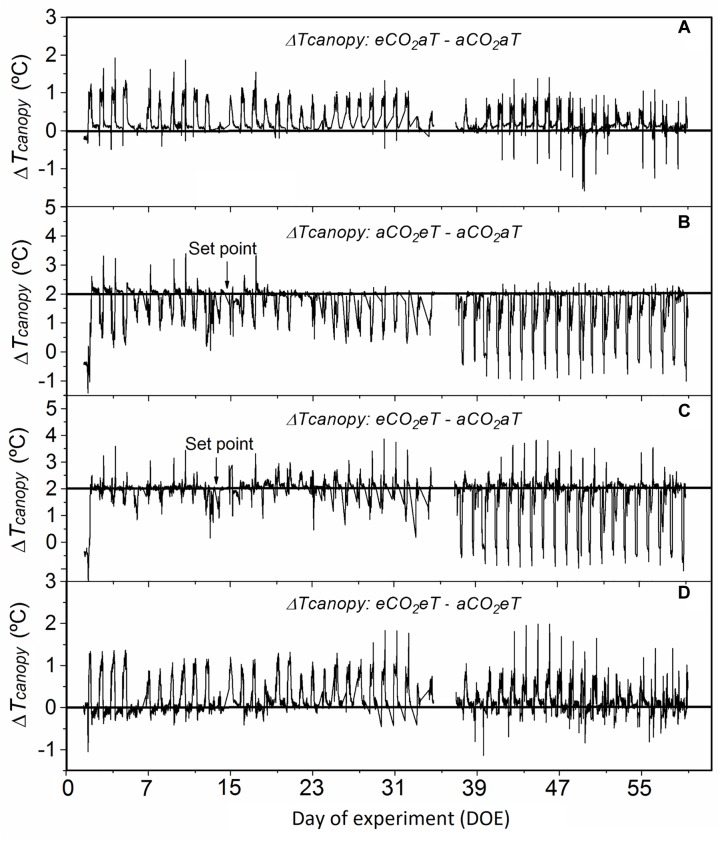
FIGURE 3.
Difference in canopy temperature (Δ Tcanopy) of Stylosanthes capitata during the experiment. (A) Δ Tcanopy between eCO2aT–aCO2aT plots. (B) Δ Tcanopy between aCO2eT–aCO2aT plots. (C) Δ Tcanopy between eCO2eT–aCO2aT plots. (D) Δ Tcanopy between eCO2eT–aCO2eT plots. Tcanopy was recorded every 15 min by Apogee infrared radiometers. Arrows indicate the point 2°C above the ambient canopy temperature that was set in warmed treatments. The missing values between days 35 and 37 after treatment are due to a dead datalogger battery on these days. Treatments: aCO2aT (ambient [CO2] and ambient temperature), eCO2aT (elevated [CO2] and ambient temperature), aCO2eT (ambient [CO2] and elevated temperature) and eCO2eT (elevated [CO2] and elevated temperature).

