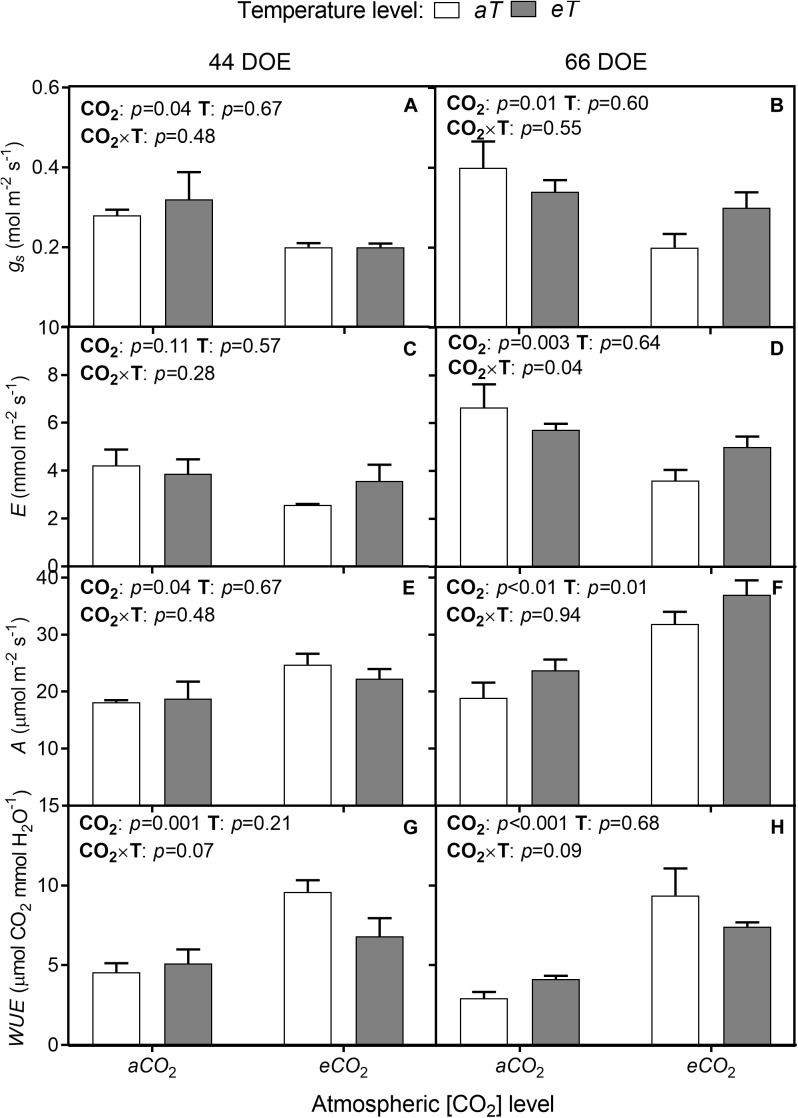
FIGURE 5.
Leaf gas exchange of S. capitata performed at 44th (left column) and 66th DOE (right column) under different levels of [CO2] and temperature. (A,B) Stomatal conductance (gs). (C,D) Transpiration rate (E). (E,F) Net photosynthesis rate (A). (G,H) Instantaneous water-use efficiency (WUE). [CO2] levels: ambient (aCO2) and elevated (eCO2, 600 μmol mol-1). Temperature levels: ambient (aT) and elevated (eT, +2°C above ambient canopy temperature). DOE = day of experiment. ANOVA p-values are shown for main effects (CO2 or T) or interactions CO2 × T. Stack bars indicate the standard error.

