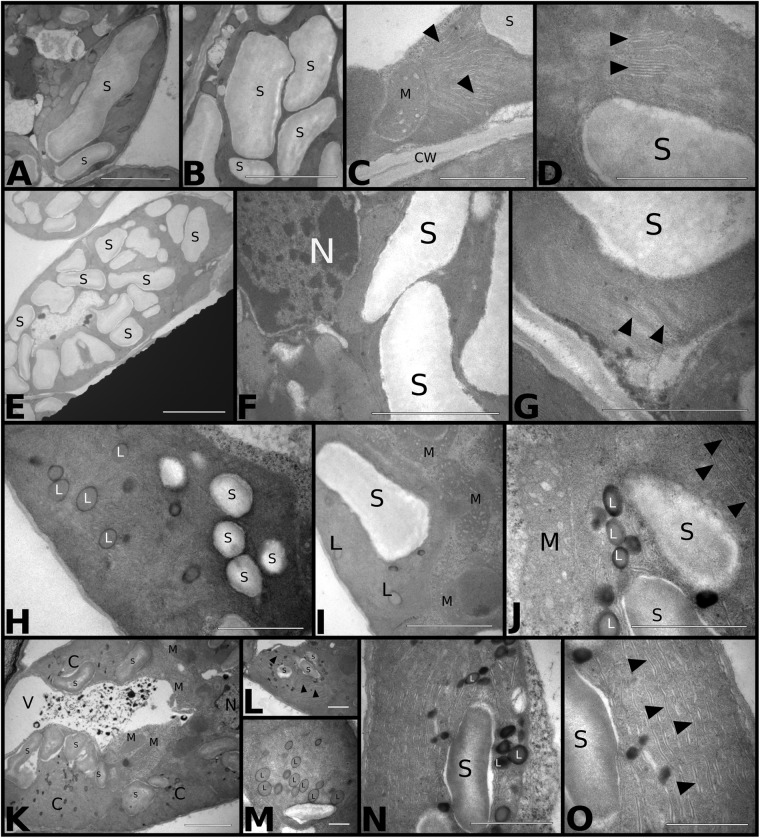
FIGURE 6.
Transmission electron micrograph of S. capitata leaves grown under different levels of [CO2] and temperature at 66th day of experiment. (A–D) aCO2aT samples. (A,B) Longitudinal section of chloroplast showing large and numerous starch grains. Scale bar of 10 μm in panels (A,B). (C) Longitudinal section of the terminal portion of a chloroplast associated with mitochondria. Arrowheads show intact thylakoid membranes. Scale bar 3 μm. (D) Details of thylakoid membranes of an intact chloroplast (arrowhead). Scale bar 2 μm. (E–G) eCO2aT samples. (E) Overview of a chloroplast in longitudinal section showing a large number of starch grains. Scale bar 10 μm. (F) Enlarged cell. Scale bar 4 μm. (G) Details of a chloroplast showing the integrity of thylakoid membranes (arrowhead). Scale bar 3 μm. (H–J) aCO2eT samples (H) Overview of a chloroplast from leaf mesophyll with a reduced number and size of starch grains and the presence of plastoglobuli in the stroma of chloroplast. Scale bar 3 μm. (I,J) Detail of chloroplasts with a greater association with mitochondria. (J) Evidence that the internal membranes are less organized in the thylakoid (arrowhead). Scale bars 3 μm in (I) and 2 μm in (J). (K–O) eCO2eT samples. (K) Overview of the mesophyll cell with chloroplasts in association with mitochondria and vacuole with presence of electrodense amorphous material. Scale bar 5 μm. (L) Detail of a chloroplast in longitudinal section. Arrowhead – internal membranes of chloroplasts. Scale bars 2 μm. (M) Detail of chloroplasts in cross section showing the large number of plastoglobuli in the stroma. Scale bar 2 μm. (N,O) Details of chloroplasts showing plastoglobuli, starch grains, and internal membranes not associated in thylakoids (arrowhead). Scale bar 3 μm in N and O. Abbreviations: S, starch grain; M, mitochondria; CW, cell wall; N, nucleus; L, plastoglobuli; C, chloroplasts; V, vacuole.

