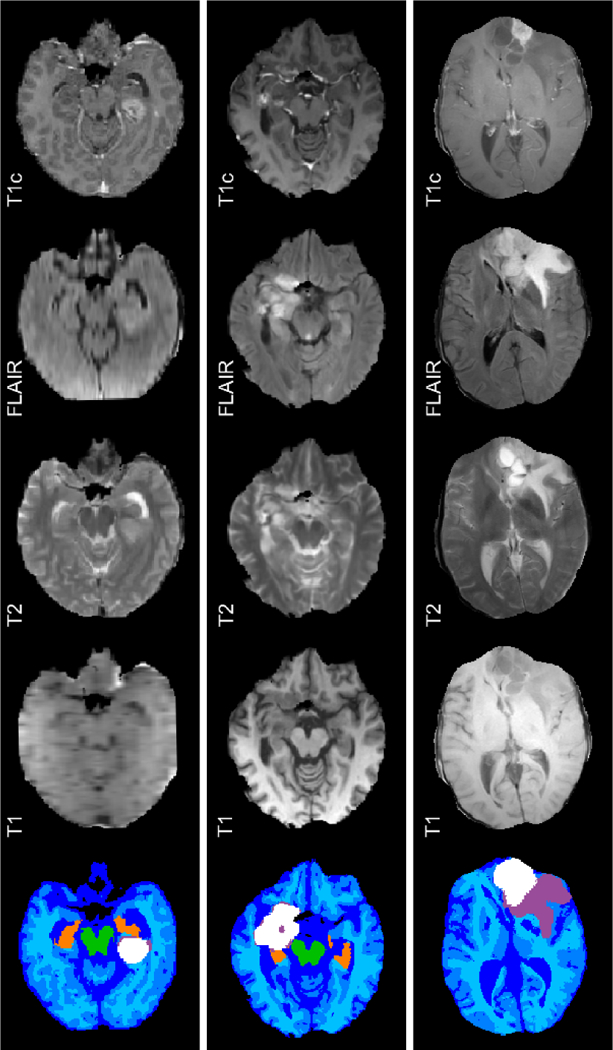
Figure 12:

Three representative segmentations in the BRATS test dataset. Slices of T1c, FLAIR, T2, T1, and automatic segmentation. Label colors: white = TC, lilac = edema, green = BS, dark orange = HC, shades of blue = other brain tissues. Note that the images are skull-stripped by the BRATS challenge organizers.
