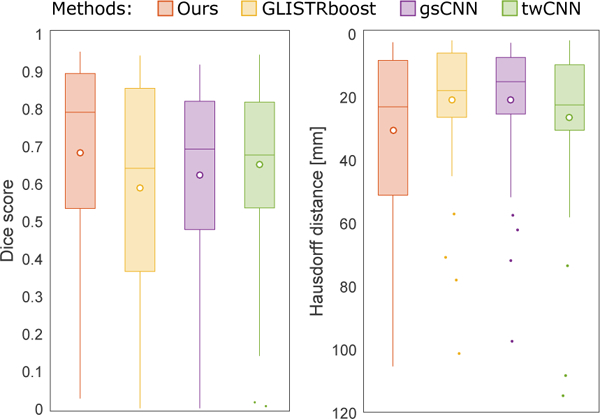
Figure 13:

Box plots of Dice scores and Hausdorff distances for tumor core on the BRATS 2015 test dataset. 53 subjects in total. Scores are as reported in the challenge. On each box, the central line is the median, the circle is the mean and the edges of the box are the 25th and 75th percentiles. Outliers are shown as dots.
