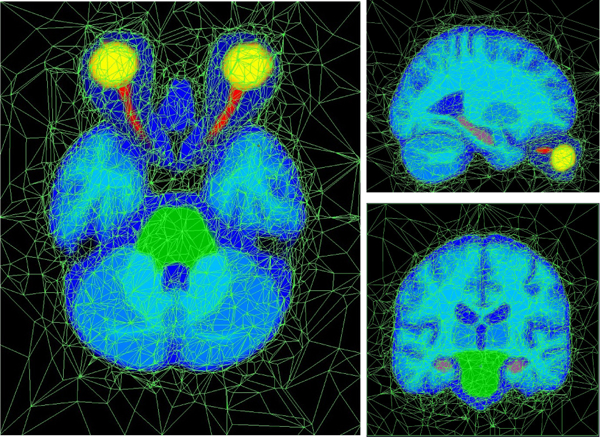
Figure 3:

The built atlas in axial, sagittal, and coronal view; shown in atlas space. Nodes and connections between nodes are shown in light green and probabilities of normal labels, interpolated between the nodes, are shown in varying colors (yellow = eye fluid, orange = eye tissue, red = optic nerves, green = brainstem, lilac = hippocampi, shades of blue = other normal labels).
