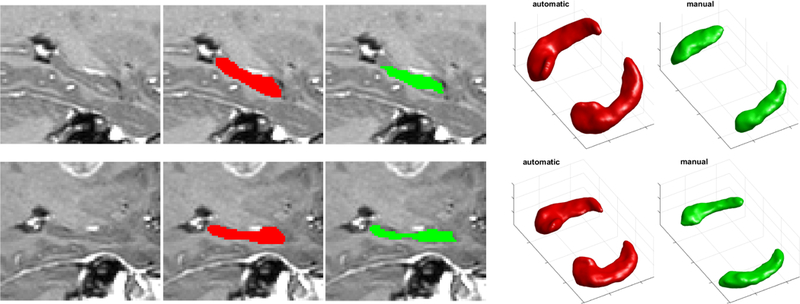
Figure 6:

Hippocampi on two representative subjects in the Copenhagen dataset. Automatic segmentations (for {T1c, CT, FLAIR, T2}) in red and manual segmentations in green. Slice of segmentation overlaid on the T1-weighted scan and 3D surface plot of full structure. For left and right hippocampus: Dice score: {0.54,0.58},{0.63,0.67}; Hausdorff distance: {13,10}, {8,7}.
