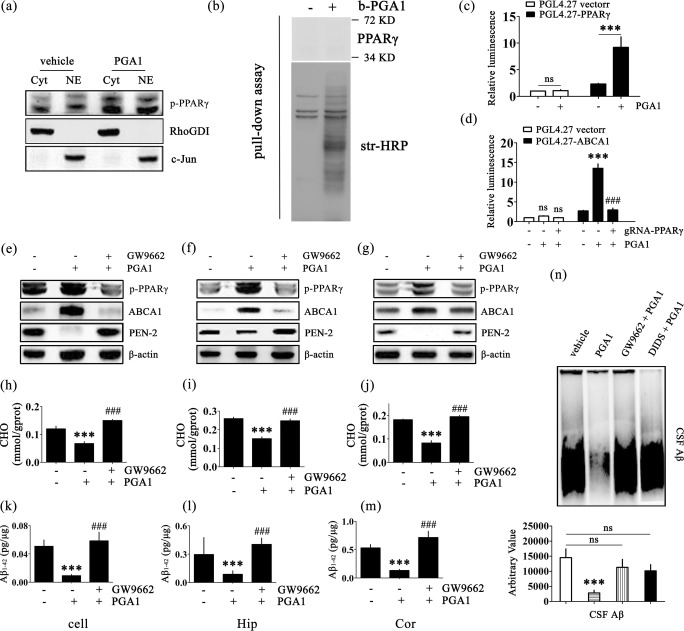
Fig. 5.
The signalling pathway of PPARγ/ABCA1/CHO mediates the effects of PGA1 on decreasing the levels of Aβ1-42. (a) Nuclear (NE) and cytosolic (Cyt) fractions were obtained from APPsw cells treated with or without PGA1 in a final concentration of 10 μM for 48 h. Western blot for p-PPARγ were analyzed with an anti-p-PPARγ antibody. RhoGDI served as cytosolic marker, and c-Jun served as nuclear marker. (b) APPsw cells treated with or without b-PGA (60 μM, 2 h) were used for the pull-down assay. Western blot for PPARγ were analyzed with an anti-PPARγ antibody. Total biotinylated proteins were analyzed with str-HRP. (c) Cells transfected with the pGL4.27 vector or pGL4.27-PPARγ were treated with or without PGA1 in a final concentration of 10 μM for 48 h. (d) Cell transfected with the pGL4.27 vector or pGL4.27-ABCA1 were treated with or without PGA1 in a final concentration of 10 μM in the absence or presence of gRNA-PPARγ for 48 h. The relative luminescence (firefly/Renilla) was calculated and normalized to the control reporter in the cells. (e–n) APPsw cells were treated with PGA1 in a final concentration of 10 μM in the absence or presence of GW9662 in a final concentration of 1 μM for 48 h. In the APP/PS1 Tg mice, 5 μL of PGA1 was injected (i.c.v.) to the cerebral ventricles at a concentration of 1 μg/μL in the absence or presence of GW9662 (5 μL, 40 μM) for 48 h. (e–g) The phospohrylation of PPARγ and protein levels of ABCA1 and PEN-2 were analyzed by Western blot and β-actin served as the internal control. Intracellular levels of cholesterol (h–j) or the levels of Aβ1-42 (k-m) were determined by ELISA. (n) The aggregated form of Aβ determined by SDD-AGE (upper panel). The relative intensity of SDD-AGE bands was calculated by the Image J software (lower panel). The data represent means ± S.E. of 6 independent experiments. ***p < 0.001 compared to vehicle-treated cells or mice. ###p < 0.001 compared to PGA1-treated cells

