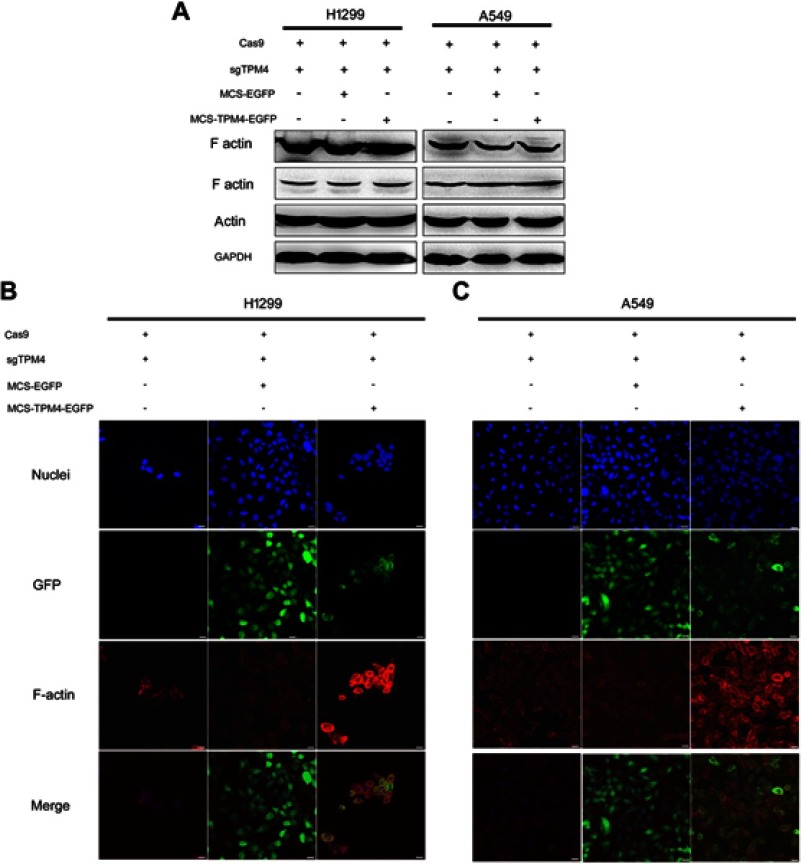
Figure 5.
F-actin assembly was increased when TPM4 was upregulated. (A) WB technique was used to determine F-actin level in TPM4 upregulating cells as well as control cells. The actin level was used as a control, with GADPH used as the internal loading controls. (B, C) F-actin was labeled by immunofluorescence staining. The red signal represents the staining of F-actin, the green signal represents the fluorescence of GFP, and the blue signal represents the nuclear DNA staining by Hoechst 33342. Bars represent 20 μm.
Abbreviation: WB, Western blot.

