Figure 8.
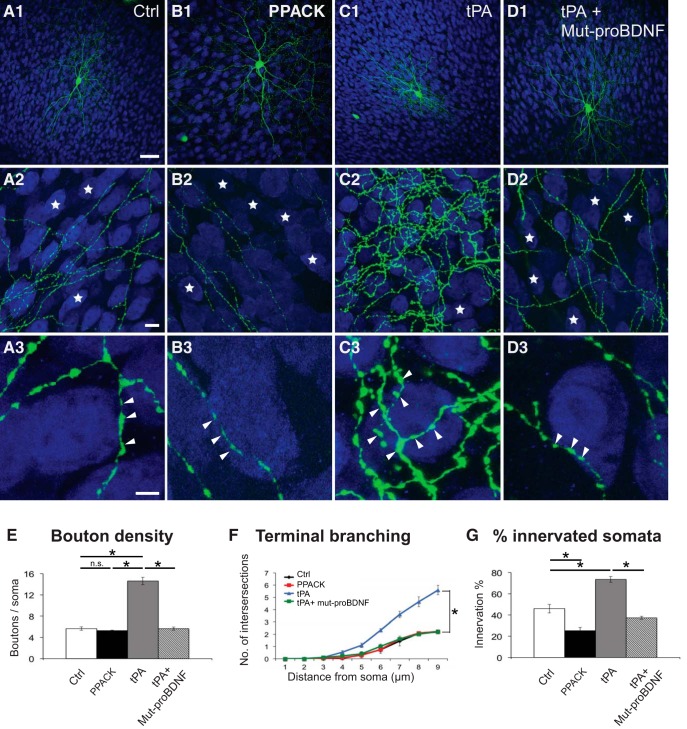
Modulation of tPA activity affects the formation of PV cell innervations during early postnatal development. A, Control EP18 PV cell (A1, green represents Ctrl). B, PV cell treated with the tPA inhibitor PPACK from EP10–EP18 shows simpler axonal arborization, contacting less potential targets (B2, blue represents NeuN-positive somata). C, PV cell treated with tPA in the same time window shows a very complex axonal arbor (C2) and an increase in both terminal branching and perisomatic boutons (C3, arrowheads) compared with control cells (A2, A3). D, PV cell treated simultaneously with tPA and mut-proBDNF shows axonal branching and perisomatic innervation more similar to those formed by PV cell treated with mut-proBDNF alone, suggesting that the effects of tPA application may be mediated by a decrease in endogenous proBDNF/mBDNF ratio. Stars indicate NeuN-positive somata that are not innervated. Scale bars: A1–D1, 50 μm; A2–D2, 10 μm; A3–D3, 5 μm. E, Perisomatic boutons density (one-way ANOVA, F(3,20) = 121.2, p < 0.0001). F, Terminal branching (one-way ANOVA, at 5 μm: F(3,20) = 5.692, p = 0.0055; at 6 μm: F(3,20) = 19.67, p < 0.0001; at 7 μm: F(3,20) = 34.58, p < 0.0001; at 8 μm: F(3,20) = 32.81, p < 0.0001; at 9 μm: F(3,20) = 62.47, p < 0.0001). G, Percentage of innervated cells (one-way ANOVA, F(3,20) = 61.99, p < 0.0001) of the four experimental groups. * indicate p < 0.05. N = 6 PV cells for all experimental groups.

