Figure 2.
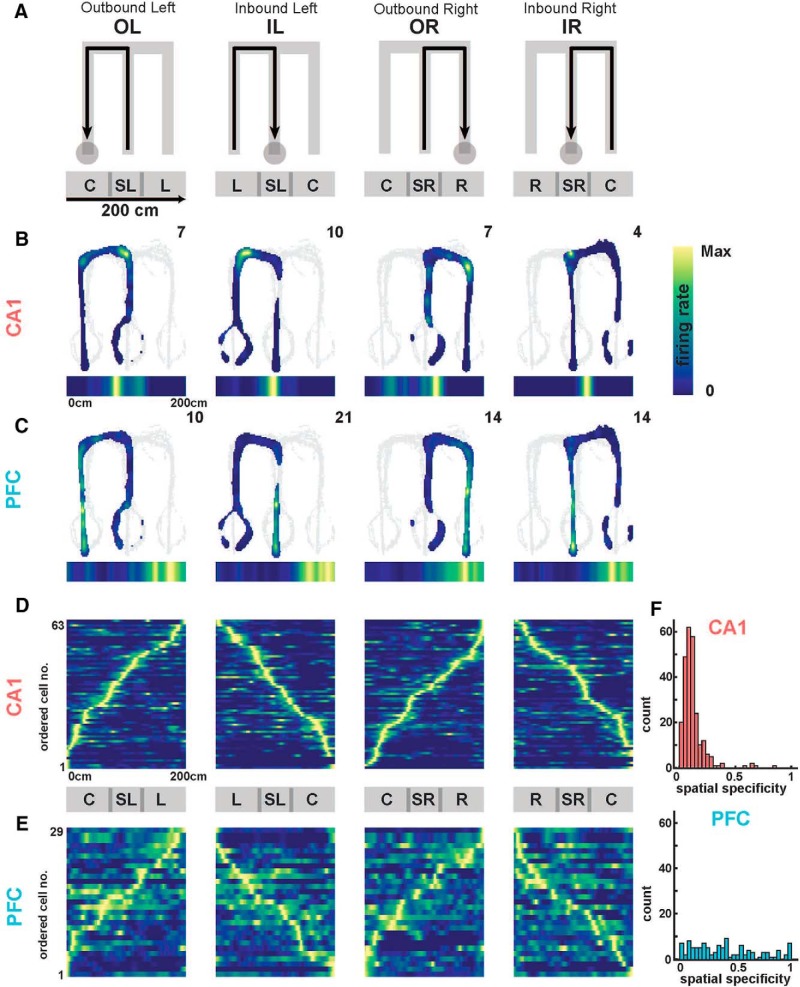
Spatial representation properties in CA1 and PFC. A, Schematic of 2D firing rate maps as a function of W-track behavioral trajectories (from left to right: OL, IL, OR, IR). Below are schematic maps of linearized (1D) trajectories showing equivalent position with respect to the 2D behavior. Track arms are labeled as described in the text (C, L, SL, R, SR). B, Occupancy normalized spatial firing rate maps of an example CA1 unit for the four separate trajectory types. Peak firing rate is reported in the top right, and linearized firing rate maps displayed below each panel. C, Same as in B, but for a representative PFC neuron. D, Population of CA1 occupancy normalized linear firing rate maps for one animal, normalized and ordered by peak firing rate for each trajectory. Population activity mapped the spatial extent in all trajectories. E, Same as in D, but for a representative PFC population in one animal. F, Spatial specificity distributions in CA1 (top) and PFC (bottom) populations across all animals. Spatial specificity of CA1 neurons was significantly higher than PFC neurons [median spatial specificity (IQR); CA1, 0.10 (0.06–0.13); PFC: 0.37 (0.17–0.62); CA1 vs PFC: Kruskal–Wallis test, p = 1e−99]. Detailed statistics are reported in the text.

