Figure 4.
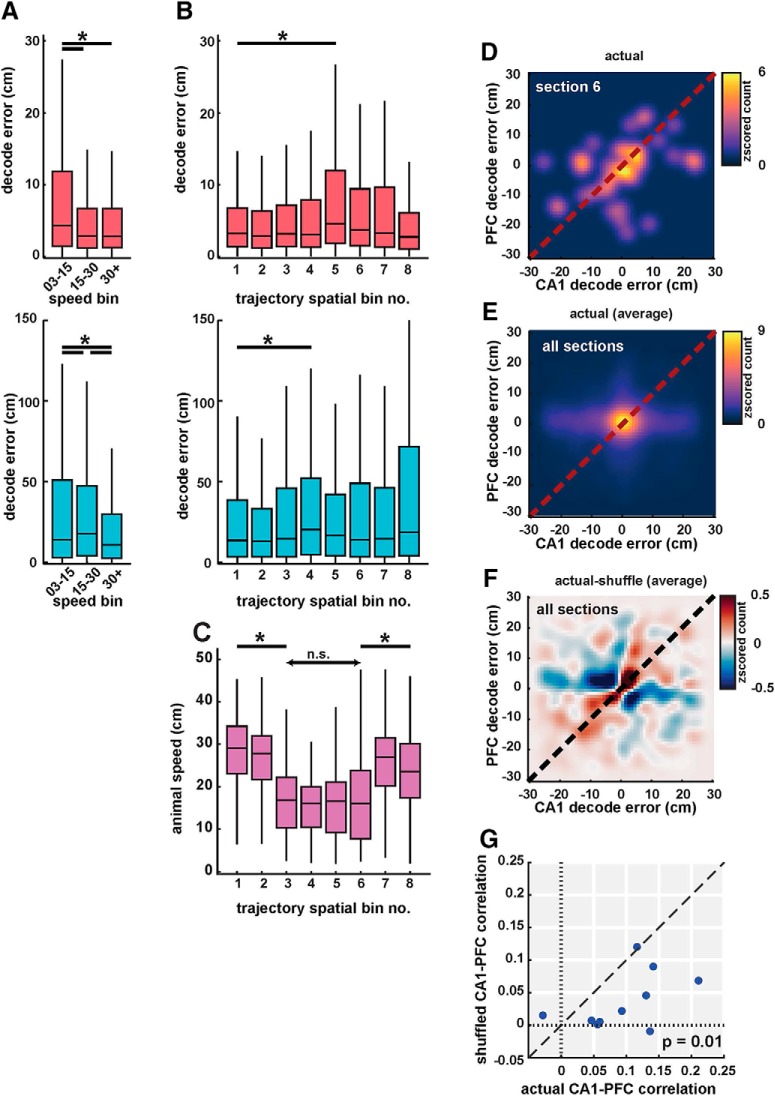
Coherent spatial position coding in CA1 and PFC. A, Decoding error from CA1 (pink, top) and PFC (cyan, bottom) populations in low (3–15 cm/s), medium (15–30 cm/s), and high speed (30+ cm/s) categories. Decoding error varied with speed in both areas. B, Decoding error as a function of spatial bin (sections) for CA1 (pink, top) and PFC (cyan, bottom). Decoding error had a small but significant increase in middle bins (Bins 4 and 5). C, Animal speed as a function of spatial bin. Animal speed decreased significantly in middle of trajectories corresponding to turn and choice point sections. D, 2D histogram showing cycle-by-cycle correlations between CA1 and PFC decoding errors in spatial section 6. Heatmap indicates z-scored histogram count of decoding error for CA1 versus PFC. E, Same as D, averaged across all spatial bins. Decoding error distribution showed peaks along the diagonal ∼0, with significant correlations for CA1 versus PFC decoding error (r = 0.10, n = 10 sessions, p = 0.001). F, Difference between decoding errors using actual and shuffled data (controlled for spatial and speed bins) shows a distribution along the diagonal, indicating strong correlations between actual decoded errors. G, Decoding error correlations for actual versus shuffled data for the 10 recording sessions. Actual correlations were significantly higher than shuffled values (mean correlation values of r = 0.10 vs r = 0.03, p = 0.01). Detailed statistics for all comparisons are reported in the text. n.s. = not significant, *p < 0.05 unless specified otherwise.

