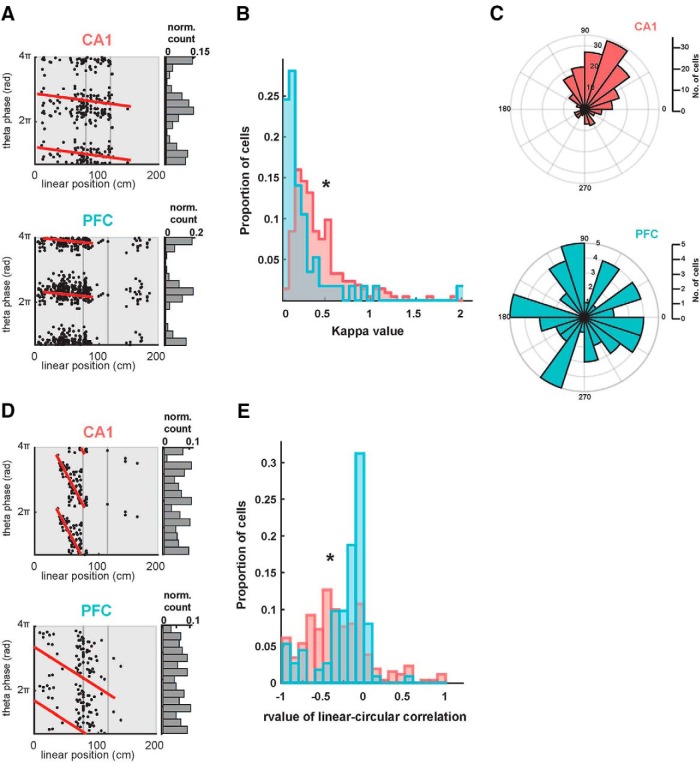
Figure 5.
Theta phase modulation of CA1 and PFC spiking. A, Examples of theta phase-locked CA1 and PFC neurons. Spikes from single neurons are plotted with corresponding theta oscillation phase and linear position indicated along the two axes. Note that spikes occur at specific phases of theta oscillations within the firing fields of the neurons, thus exhibiting a phase–space relationship. Both neurons were significantly phase-locked, assessed with a Rayleigh z test (CA1 neuron, κ = 1.1 p = 1.6e−28; PFC neuron, κ = 2.0, p = 1e−99). These neurons did not show significant phase precession (p > 0.63, red lines). B, Distribution of κ values for all phase-locked CA1 (n = 213) and PFC (n = 57) neurons. CA1 had significantly stronger phase-locking than PFC (p = 1.5e-08). C, Distribution of preferred theta phases for significantly phase-locked CA1 (n = 213) and PFC (n = 57) neurons. The two distributions are significantly different from each other (p = 0.002). D, Examples of theta phase precession in CA1 and PFC neurons. Spikes from single neurons are plotted with corresponding theta oscillation phase and linear position indicated along the two axes, with line fits for circular-linear correlation overlaid in red (CA1 neuron: ρ = −0.64, p = 1.7e−7; PFC neuron: ρ = −0.27, p = 0.02). E, Distribution of rho value (ρ) from line fits for circular-linear correlation quantifying strength of phase precession in all CA1 and PFC neurons. CA1 had significantly stronger phase precession than PFC (p = 2.7e−4). *p < 0.05 unless specified otherwise.

