Figure 6.
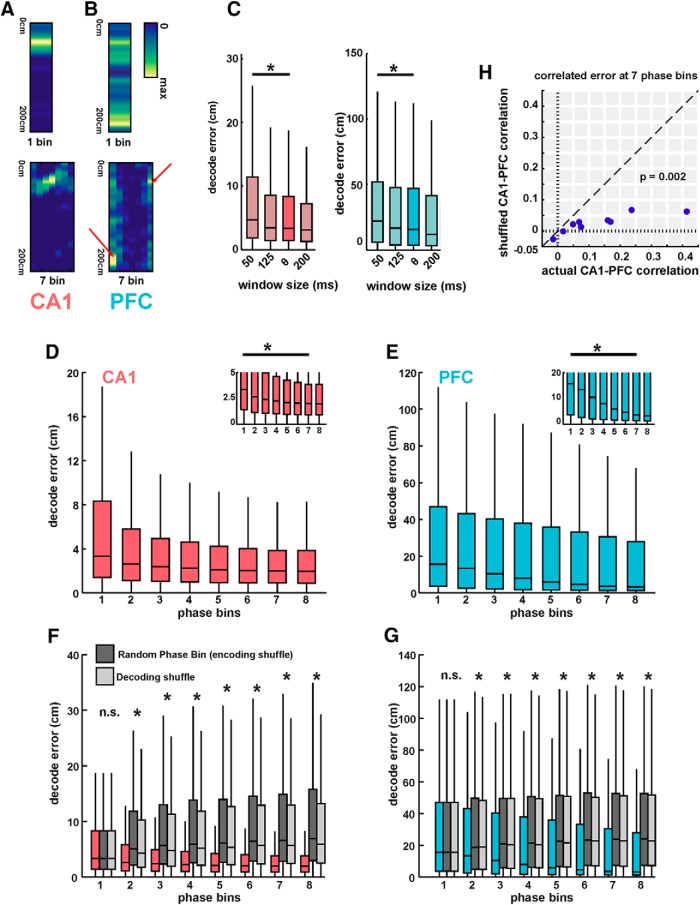
Theta phase-based templates improves spatial position decoding in both CA1 and PFC. A, Example of a CA1 firing field split into seven theta phase-based templates. This neuron exhibited strong phase precession, apparent in the phase-based templates shown on right, where preferred firing location changes with theta phase. B, Example of a PFC firing field split into seven theta phase-based templates. This neuron exhibited strong phase locking, apparent in the phase-based templates shown on right, where only preferred phase bins (indicated by arrows) shows significant spiking that is spatially localized. Non-preferred phase bins exhibit highly reduced number spikes. C, Decoding error using firing rate templates as a function of time windows. Using smaller temporal windows (50 ms) than theta cycles leads to increased decoding error (p < 3.7e−9). D, Decoding error using CA1 ensembles using successively increasing number of phase-bin templates. Phase bin 1 corresponds to a firing-rate-only template, similar to Figure 3. Decoding accuracy significantly increased until five phase bins (p ≤ 0.02, ∼2-fold improvement in median decoding accuracy), with only nonsignificant, asymptomatic improvement with subsequent increase in phase bins. Inset, Low decoding error values for clarity. E, Same as D, using PFC ensembles. Decoding accuracy significantly increased until seven phase bins (p ≤ 0.0013, ∼4-fold improvement in median decoding accuracy). F, Comparison of actual decoding error for CA1 using phase-based templates to two shuffled metrics: an equivalent number of templates, but with random assignment of theta phase (“encoding” phase bin shuffle; dark gray), and with correct construction of phase templates per neuron, but with random choice of phase template during decoding (decoding phase bin shuffle; light gray). Decoding error with shuffled templates using random phase assignment did not show any significant improvement in decoding accuracy with increase in phase bins (p < 2.3e−114 for all pairwise comparisons from 2 to 8 phase bins between actual and both shuffled decoding values). G, Same as F, using PFC ensembles. (p < 3e−34 for all pairwise comparisons from 2 to 8 phase bins between actual and both shuffled decoding values). H, Decoding error correlations for actual versus shuffled data for the 10 recording sessions for seven phase bins. Actual correlations were significantly higher than shuffled values (mean correlation values of r = 0.13 vs r = 0.02, p = 0.009). n.s. = not significant, *p < 0.05 unless specified otherwise.

