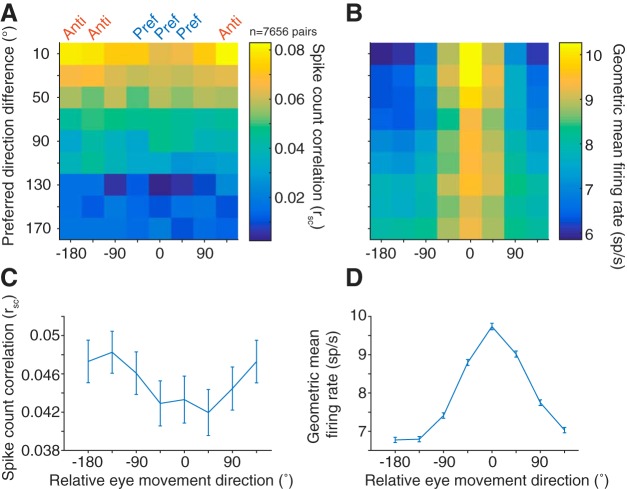
Figure 4.
Correlated variability and eye movement direction. A, Average rsc in each of the 8 conditions binned by preferred direction difference. B, Same binning as in A, but with geometric mean firing rate. Across all preferred direction differences, though more prominent for pairs with similar tuning, rsc was lower in the preferred directions (Pref) of a pair compared with antipreferred directions (Anti), despite the higher firing rate in the preferred directions. C, Average rsc across all pairs for each of the 8 conditions, relative to the preferred direction of each pair. D, Same as in C, but with geometric mean firing rate.

