Figure 5.
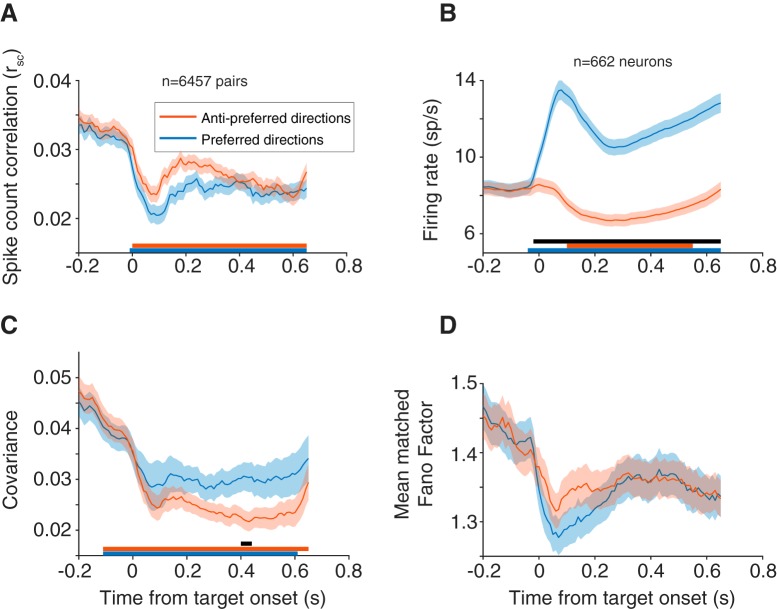
Time course of rsc starting at fixation (t = −0.2) through stimulus presentation (t = 0.0 to t = 0.05) until fixation offset (t = 0.65). rsc was calculated in overlapping 100 ms bins, with a sliding window of 10 ms. Each time point corresponds to the leftmost point of the bin (t = 0 for example corresponds to rsc in a window from 0 to 100 ms). All panels use this window analysis. A, rsc time course for preferred and antipreferred directions. Both conditions showed a decrease in rsc after stimulus onset, lower for the preferred direction, that was persistent throughout the delay epoch. B, Same time course as in A, but with individual neuron firing rate. C, Covariance across pairs for preferred and antipreferred directions. Covariance decreased after stimulus onset and was higher in preferred compared with antipreferred directions. A–C, Statistical data points for are plotted as lines under each subplot. Lines corresponding to the colors in the plot represent each condition relative to baseline (baseline = average in 200 ms after fixation but before stimulus onset). Black line indicates differences between the two conditions (see Materials and Methods). D, Mean matched Fano factor followed the same time course as rsc: a decrease after stimulus onset (more in the preferred direction) that was persistent throughout the entire period. Pairs from a small number of sessions (n = 1199 pairs, 24 sessions), where the time course varied (delay epoch = 550 ms or stimulus duration = 100 ms) were removed from this analysis.

