Figure 8.
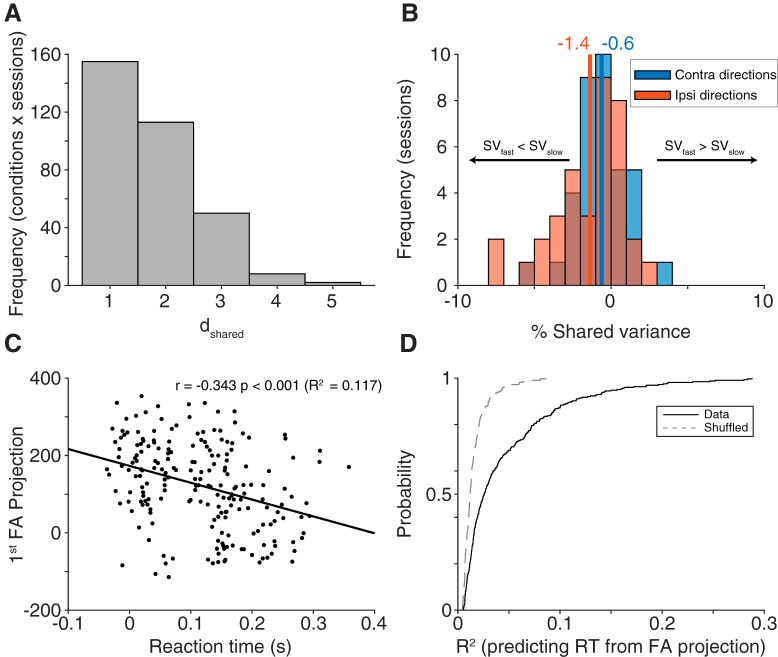
FA. A, Dimensionality (dshared) calculated for each condition in each session separately (n = 328, 8 conditions each from 41 session). Most conditions had an optimal dimensionality of 1. B, Change in shared variance (SV, fast trials-slow trials) for each session, separated into contralateral and ipsilateral directions (n = 36 for each direction). For both directions, shared variance was lower in fast trials compared slow trials, with a stronger effect in ipsilateral directions, consistent with our correlated variability findings. C, Example condition from one session (n = 205 trials, Monkey Wi, session 109) demonstrating a strong relationship between the first FA dimension's projection value and reaction time. D, Population summary (n = 41 sessions) of R2 values from a linear fit between the first FA dimension's projection value and reaction time (fit to each condition separately, all session and conditions shown with the solid black line). The relationship between projection value and reaction time was significantly stronger compared with a shuffled distribution shown with a gray dashed line (p < 0.001, Wilcoxon sign rank test).

