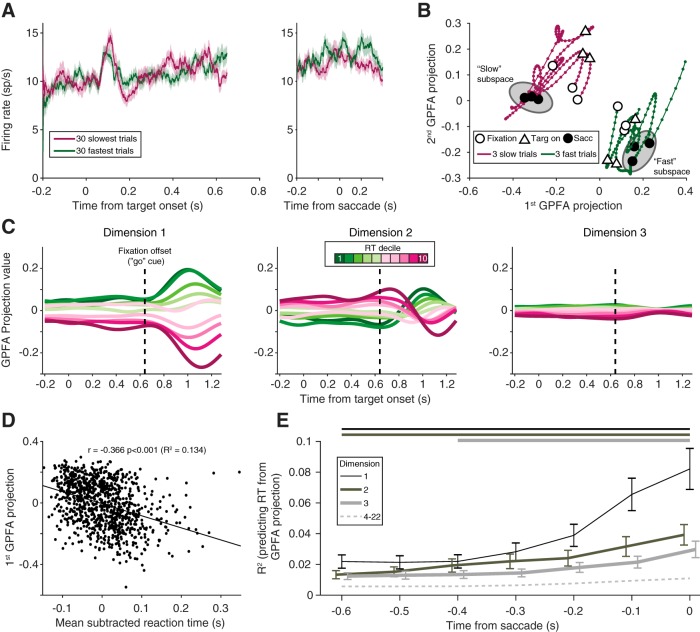
Figure 9.
GPFA. A, Population PSTH for an example session (Monkey Ro, session 123) for the 30 fastest (green) and 30 slowest (purple) trials, aligned to the stimulus and the saccade. Shading represents SE across trials. No systematic difference was observed in the average firing rate of the population. B, Example trajectories from the same session as in A, plotted in GPFA space for 3 trials in the first reaction time decile (fast trials, green) and the 10th reaction time decile (slow trials, purple). Throughout the course of the trial, fast and slow trials occupied different neural spaces, despite their average PSTHs overlapping. Gray ellipses represent the concept of an “optimal subspace” for movement generation (Churchland et al., 2006; Afshar et al., 2011). C, Neural trajectories from the first three orthonormalized dimensions for the same session, averaged across subsets of trials based on reaction time. For each dimension, projection values were easily differentiated by reaction time, even during the delay period. Dashed vertical line indicates fixation offset. D, Relationship between the first GPFA dimension's value at the time of the saccade and reaction time for all trials in the same session. This dimension had a strong relationship with reaction time. E, R2 between GPFA dimension projection value and reaction time, averaged across sessions. Dimensions within each session were ordered using a sorting procedure (see Materials and Methods). The first three GPFA dimensions (darker, solid lines) had a significant relationship with reaction time (Wilcoxon signed rank test compared with shuffled data), that persisted throughout the delay period. Horizontal lines above the subplot indicate significant time points. This relationship was weaker for the remaining dimensions (dashed line, average of dimensions 4–22) and only significant for a few of the remaining dimensions around the time of the saccade.

