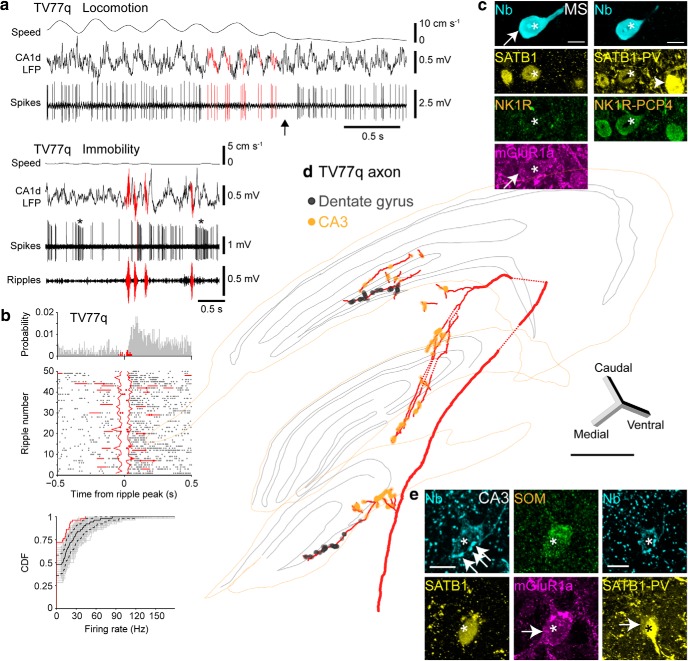
Figure 5.
Firing patterns, cortical target regions, and target neurons of a LRN innervating both CA3 and the DG. a, Firing patterns of LRN TV77q during locomotion (top) and immobility (bottom). Red indicates examples of the descending phases of theta cycles in the CA1 LFP and associated spikes (top) or SWRs (bottom). Arrow indicates theta skipping cycle. Note reduction in firing during SWRs. Asterisks indicate accommodating bursts. Note different time scales for the two behavioral states. b, Firing probability density during SWRs (red), outside SWRs (gray), and spike raster (middle) relative to detected ripples. Continuous staggered lines in raster delineate start and end of aligned ripples; horizontal lines delineate adjacent ripples. Note rebound firing after ripples. Bottom, Cumulative distribution functions (CDFs) of firing rates during ripples for real (red) and 1000 shuffled (gray) distributions from immobility periods. Black curve is the median shuffled distribution; dashed, 95% confidence intervals. c, TV77q soma (cyan, neurobiotin, asterisk) was SATB1+ (top, yellow) and mGluR1a+ (top, magenta, arrow) but NK1R− (top, green). The cell was subsequently determined to be PCP4+ (bottom, green) and PV− (bottom, yellow). Arrowhead indicates a nearby PV+ neuron. Note PV-immunoreactive terminals around the labeled cell. d, Partial reconstruction of the axon (red) and varicosities in DG (gray) and CA3 (orange). Dashed lines indicate interpolated axon. e, Terminals of TV77q (cyan, neurobiotin, arrows) were apposed to a soma containing a high level of endogenous biotin (asterisk) in CA3 SR, which was SOM+ (green), SATB1+ (left, yellow), and mGluR1a+ (magenta, arrow). The targeted cell was subsequently shown to be weakly PV+ (right, yellow, arrow). Images (z-thickness in μm and z-projection type): c, left/right 3/0.77 maximum, e, Left/right 8/8.4 maximum. Scale bars (μm): c, e, 10; d, 500.

