Figure 10.
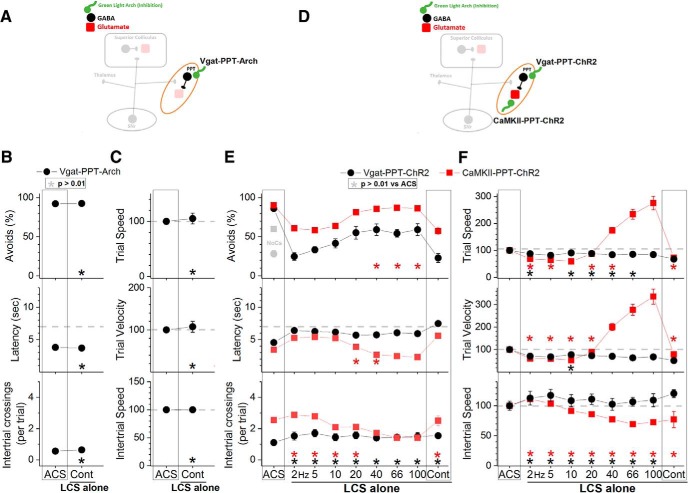
Effect of activating or inhibiting cells in the PPT on driving avoidance responses in the absence of the ACS. A, Schematic of the PPT cells inhibited in the experiments shown in B and C. B, Effect of green light applied in the PPT on LCS alone trials for animals that express Arch in GABAergic (Vgat-PPT-Arch) cells in the PPT. The asterisks highlight nonsignificant difference versus ACS trials. C, Trial speed, trial velocity, and intertrial speed for the data in B. D, Schematic of the PPT cells activated in the experiments shown in E and F. E, Effect of blue light applied in the PPT on LCS alone trials for animals that express ChR2 in GABAergic (Vgat-PPT-ChR2) or putative glutamatergic (CaMKII-PPT-ChR2) cells in the PPT. The asterisks highlight nonsignificant difference versus ACS trials. F, Trial speed, trial velocity, and intertrial speed for the data in E.

