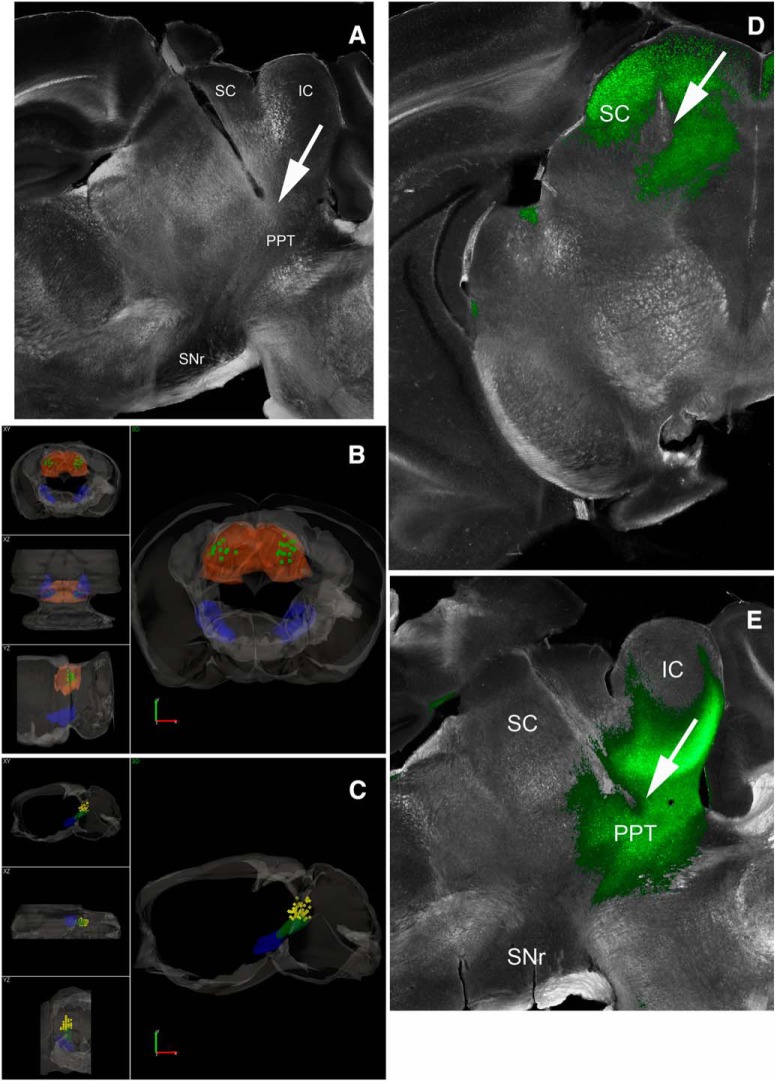
Figure 2.
Locations of implanted optical fibers in PPT and superior colliculus. A, Dark-field image of a parasagittal section (∼1 mm lateral from the midline) showing the trajectory of an optical fiber track coursing toward PPT. The PPT optical fibers are inserted at a 20° angle in the posterior direction. Stimulation of GABAergic nigrotegmental fibers with this optical fiber using blue light trains (66 Hz) at a power <1 mW completely abolished signaled active avoidance without affecting escape responses to the US (Fig. 3). B, 3D reconstruction of optical fiber track endings in the superior colliculus (SC; green squares) for brains cut in the coronal plane. SNr and SC are filled in semitransparent blue and orange, respectively. Scale bars, 1.0 mm. A video of the 3D reconstruction is provided (Movie 1). C, 3D reconstruction of optical fiber track endings in the PPT (yellow diamonds) for brains cut in the sagittal plane. SNr and PPT are filled in semitransparent blue and green, respectively. The bilateral optical fibers from both hemispheres are shown in the same hemisphere. Scale bars, 1.2 mm. A video of the 3D reconstruction is provided (Movie 2). D, Photomicrograph showing eYFP fluorescence in the superior colliculus of a CaMKII-SC-ChR2 mouse (coronal section). Image blends a dark-field image of the section with the green channel of the fluorescent image. The arrow points to the optical fiber tract implanted in superior colliculus. E, Photomicrograph showing eYFP fluorescence in the PPT of a CaMKII-PPT-ChR2 mouse (parasagittal section). Image blends a dark-field image of the section with the green channel of the fluorescent image. The arrow points to the optical fiber tract implanted in PPT. IC, Inferior Colliculus.

