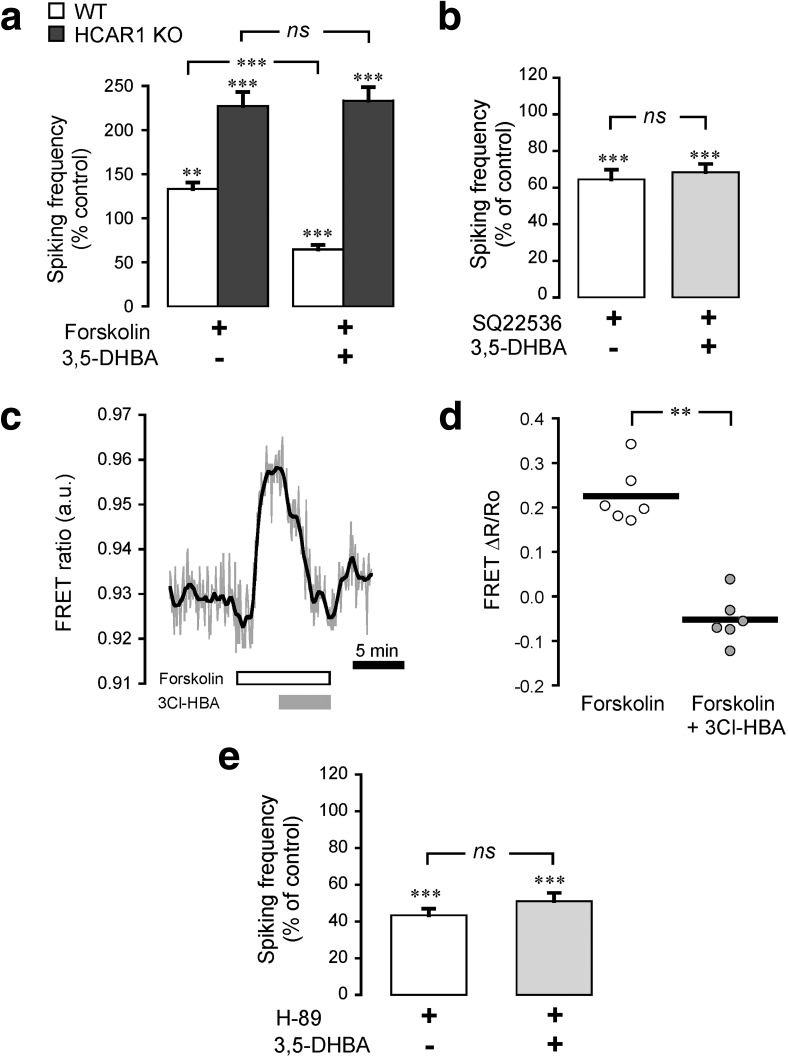
Figure 4.
Adenylyl cyclase, cAMP, and PKA involvement in neuronal HCAR1 signaling. a, Activation of AC with forskolin (10 μm) increased spiking activity in both WT (n = 44 cells, 5 experiments) and HCAR1 KO (n = 29 cells, 3 experiments) neurons compared with their respective baseline activity. b, Application of 3,5-DHBA (1 mm), in sequence with forskolin, decreased spiking activity in WT, but not in HCAR1 KO neurons. Inhibition of AC with SQ22536 (10 μm) decreased spiking activity in WT neurons (n = 46 cells, 6 experiments). Application of 3,5-DHBA, in sequence with SQ22536, caused no further decrease in neuronal activity. c, Representative trace of the effects of HCAR1 activation on cAMP levels measured using the Epac2-camps FRET sensor. The FRET (CFP/YFP) ratio, proportional to the cAMP levels, is shown for a single neuron along the timeline. Application of the AC activator forskolin (10 μm) caused a rapid signal rise, and the subsequent HCAR1 activation using 3Cl-HBA (40 μm) reversed this increase. d, Summary of absolute FRET ratio values in the presence of forskolin before and after stimulation of HCAR1 using 3Cl-HBA. The graph shows individual values plotted along with the mean value of all experiments (n = 6 cells, 6 experiments). e, Inhibition of PKA with H-89 (1 μm) decreased spiking activity in WT neurons (n = 64 cells, 6 experiments). Application of 3,5-DHBA, in sequence with H-89, did not further decrease neuronal activity. Significance is shown compared with control and among conditions in a, b, and e. **p < 0.01, ***p < 0.001, ns, not significant.

