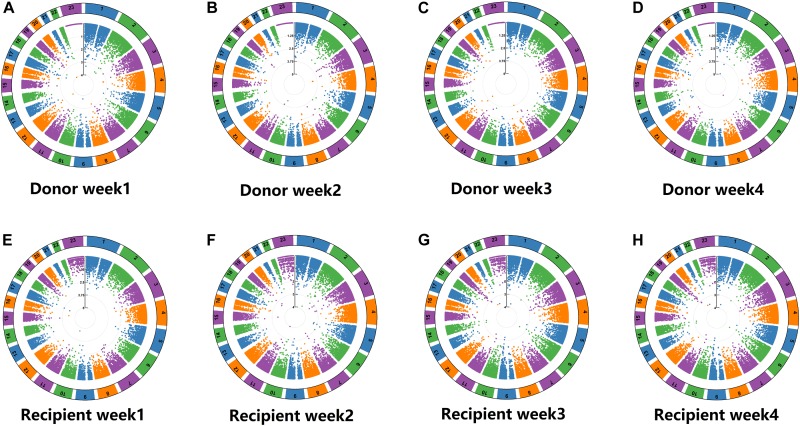
FIGURE 1.
Manhattan plots of single-nucleotide polymorphisms (SNPs) associated with ln(TAC C0/D ratio) in donors and recipients respectively. Total > 240,000 markers were analyzed toward natural log of dose-normalized tacrolimus trough concentrations between donors and recipients in the first 4 weeks with adjustment of age, donor gender, gender and BMI. All SNPs were shown in order from chromosome 1 to 23 (not including Y chromosome). (A) Manhattan plots of single-nucleotide polymorphisms (SNPs) associated with ln(TAC C0/D ratio) in donors in week 1. (B) Manhattan plots of single-nucleotide polymorphisms (SNPs) associated with ln(TAC C0/D ratio) in donors in week 2. (C) Manhattan plots of single-nucleotide polymorphisms (SNPs) associated with ln(TAC C0/D ratio) in donors in week 3. (D) Manhattan plots of single-nucleotide polymorphisms (SNPs) associated with ln(TAC C0/D ratio) in donors in week 4. (E) Manhattan plots of single-nucleotide polymorphisms (SNPs) associated with ln(TAC C0/D ratio) in recipients in week 1. (F) Manhattan plots of single-nucleotide polymorphisms (SNPs) associated with ln(TAC C0/D ratio) in recipients in week 2. (G) Manhattan plots of single-nucleotide polymorphisms (SNPs) associated with ln(TAC C0/D ratio) in recipients in week 3. (H) Manhattan plots of single-nucleotide polymorphisms (SNPs) associated with ln(TAC C0/D ratio) in recipients in week 4.

