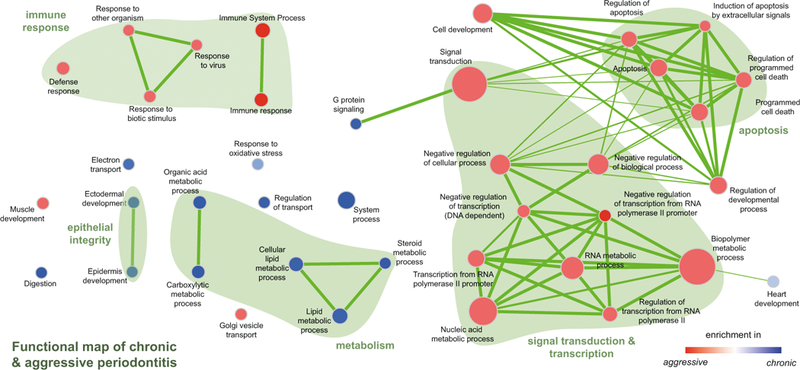
Fig. 3.

Visualization of GSEA results using the Enrichment Map plugin in Cytoscape. Reprinted from [4] with permission from Sage. Visualization of gene sets significantly enriched in diseased gingival tissues from patients with chronic or aggressive periodontitis. Gene sets are depicted as nodes in a network. Color describes the disease entity (red for AP and blue for CP), and the color intensity represents the degree of enrichment. The size of the node represents the size of the enriched gene set, and the thickness of the connectors stands for the degree of overlap between the nodes [18]
