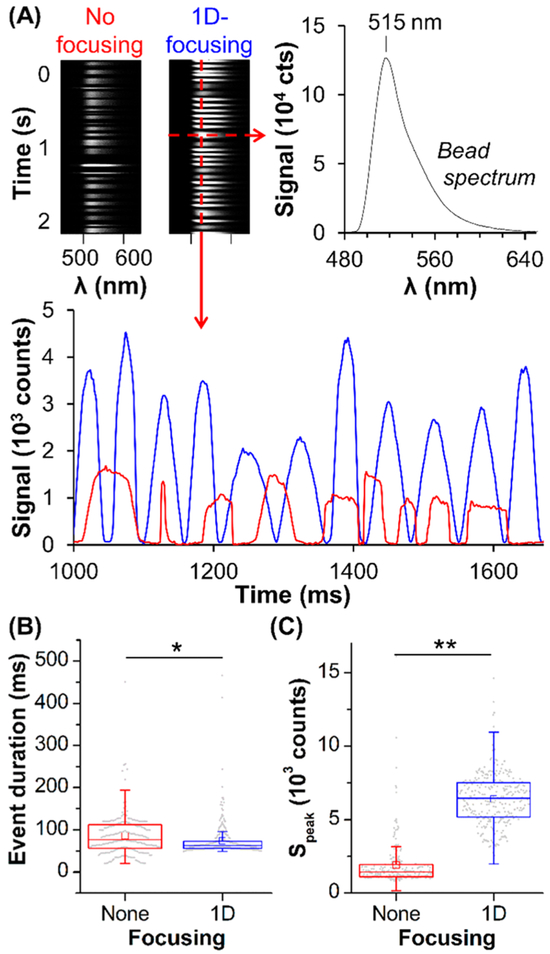
Figure 3.
(A) TDI imaging of fluorescent beads (100% intensity) without focusing (red) and with 1D microfluidic focusing (blue): spectra acquired over 2 s with background data between events removed, a bead spectrum, and the signal at λmax (515 nm) over time. (B,C) Box plots of (B) Δt and (C) Speak. The middle line shows the median; box edges show the lower and upper quartiles; the bars show minima and maxima, excluding outliers; the squares show averages; and the dots represent all the data. Statistical analyses demonstrated significance at p < 10−2 (*) and p < 10−4 (**). Sample and sheath flow rates were 0.178 and 0.217 μL/min, respectively, with the 10× objective and 4 mW excitation.

